
May 28, 2026 a 02:03 pm

AJG: Trend and Support & Resistance Analysis - Arthur J. Gallagher & Co.
Arthur J. Gallagher & Co. is an influential player in the insurance brokerage, consulting, and claims settlement industry, functioning across several global locations. The stock has shown varied movements over the months, demonstrating both strong upward momentum and periods of correction. Continued monitoring of its financial indicators and market conditions is advised to make informed investment decisions.
Trend Analysis
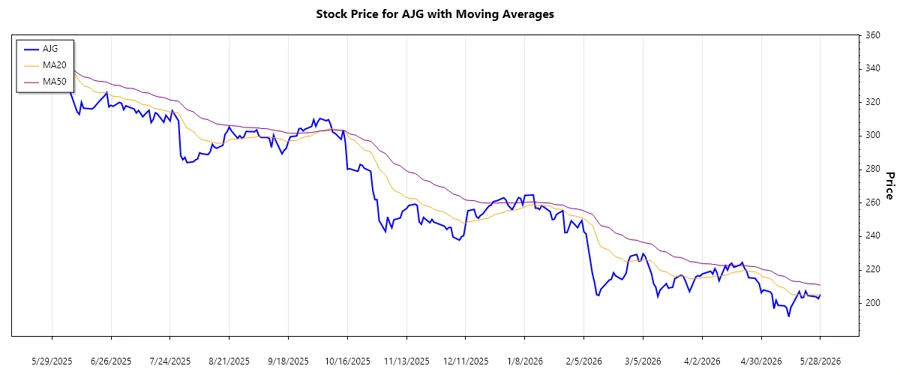
Based on the historical price data, we will analyze the trend for AJG by calculating EMAs (20 and 50 periods) and observe the price movements in recent days to determine the direction.
| Date | Close Price | Trend |
|---|---|---|
| 2026-05-28 | 205.45 | ▼ Abwärtstrend |
| 2026-05-27 | 202.85 | ▼ Abwärtstrend |
| 2026-05-26 | 203.96 | ▼ Abwärtstrend |
| 2026-05-22 | 204.75 | ⚖️ Seitwärtstrend |
| 2026-05-21 | 207.41 | ⚖️ Seitwärtstrend |
| 2026-05-20 | 203.61 | ▼ Abwärtstrend |
| 2026-05-19 | 203.45 | ▼ Abwärtstrend |
The current trend indicated by the EMA calculations shows a dominant downtrend, with EMA20 consistently below EMA50. This suggests sustained selling pressure on the stock.
Support- and Resistance
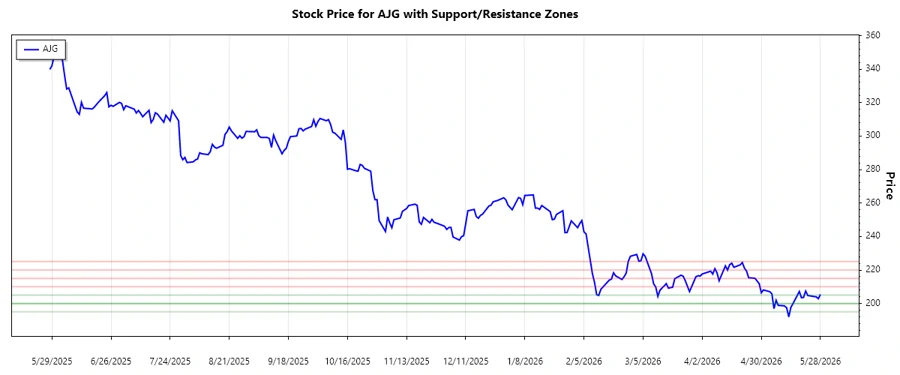
The recent price movements for AJG are evaluated for key support and resistance zones, crucial for traders and investors to identify potential entry and exit points.
| Zone | From | To |
|---|---|---|
| Support Zone 1 | 200.00 | 205.00 |
| Support Zone 2 | 195.00 | 200.00 |
| Resistance Zone 1 | 210.00 | 215.00 |
| Resistance Zone 2 | 220.00 | 225.00 |
The current price is approaching the lower band of the support zone 1, suggesting potential stabilization, but a break below could see a further decline into support zone 2.
Conclusion
The Arthur J. Gallagher & Co. stock is currently in a downtrend, as indicated by EMA analysis and recent price behavior. The stock is near its support zone, which offers potential stabilization and a buying opportunity if it holds. However, breaching the support could lead to further downward movement. Investors should watch for confirmation signals, weighing current market conditions against technical indicators to gauge the next move. Opportunities for shifts in momentum arise if the stock reclaims resistance levels, setting the stage for potential gains.
Smart Data Insight
Master the Perfect Entry & Exit for this Stock
Don't leave your profits to chance. Historically, this stock follows specific seasonal patterns that institutional traders use to maximize returns.
- ✅ Identify the "Golden Buying Window"
- ✅ Avoid high-risk correction cycles
- ✅ Backtested data from the last 20+ years