November 24, 2025 a 12:46 pm

AJG: Dividend Analysis - Arthur J. Gallagher & Co.
Arthur J. Gallagher & Co. demonstrates a robust dividend profile, supported by a consistent 41-year streak without major cuts since 1989. With a modest yield of 1.03% and gradual, steady growth over the past five years, AJG offers a reliable investment for income-focused investors seeking stability in the financial sector.
📊 Overview
The financial sector's dividend trends act as a barometer for stability and investor confidence. AJG's dividends, underpinned by its significant market cap of over $64 billion and a substantial 37.2% EPS payout ratio, are emblematic of its disciplined financial management.
| Parameter | Value |
|---|---|
| Sector | Financials |
| Dividend Yield | 1.03% |
| Current Dividend per Share | 2.38 USD |
| Dividend History | 41 years |
| Last Cut or Suspension | 1989 |
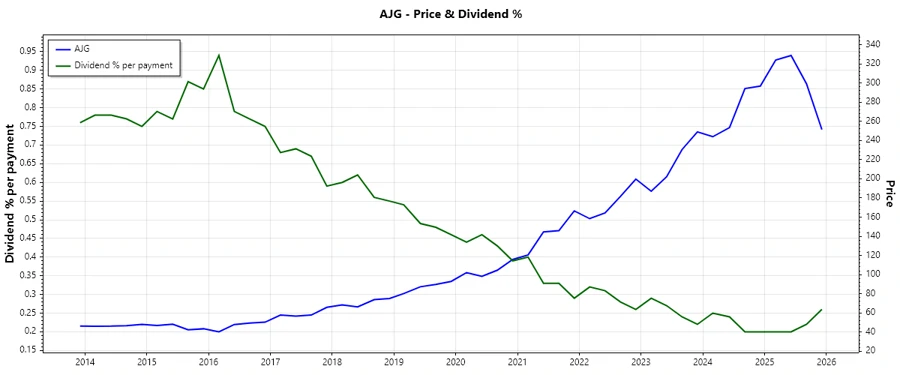
🗣️ Dividend History
Examining dividend history provides insights into the commitment and capability of a firm to return capital to investors. Over the past decades, AJG has shown commendable consistency, enhancing investor trust and warranting high capital allocation confidence despite cyclical market upheavals.
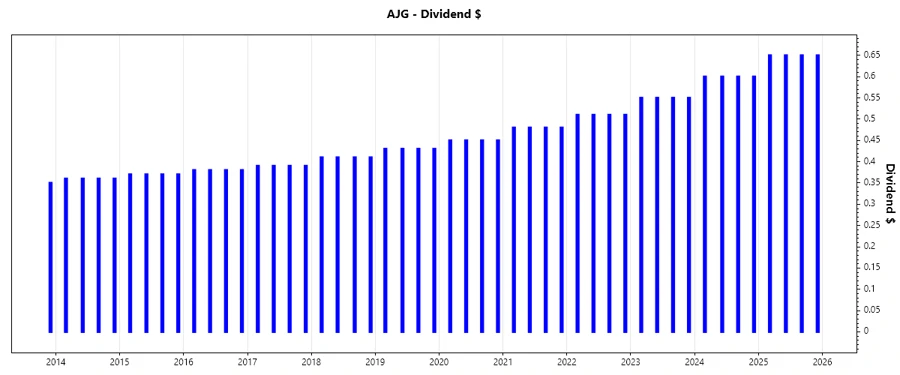
| Year | Dividend per Share (USD) |
|---|---|
| 2025 | 2.60 |
| 2024 | 2.40 |
| 2023 | 2.20 |
| 2022 | 2.04 |
| 2021 | 1.92 |
📈 Dividend Growth
AJG's dividend growth is a testament to its strategic financial positioning, illustrating how management decisions translate into shareholder wealth. Growth rates over three and five years emphasize both agility and foresight amid a competitive sector.
| Time Period | Growth |
|---|---|
| 3 years | 7.72% |
| 5 years | 6.89% |
The average dividend growth is 6.89% over 5 years. This shows moderate but steady dividend growth, confirming AJG's capacity to enhance shareholder returns sustainably over time.
⚠️ Payout Ratio
The payout ratio is instrumental in assessing a firm's flexibility to sustain and augment dividends amid fluctuating earnings. AJG showcases prudent payout strategies with a 37.21% based on EPS and a notably conservative 31.03% free cash flow-based ratio.
| Key Figure | Ratio |
|---|---|
| EPS-based | 37.21% |
| Free Cash Flow-based | 31.03% |
These ratios indicate that AJG maintains a strong dividend sustainability profile, ensuring that shareholder payouts are well-covered without hampering reinvestment potential or capital reserves.
✅ Cashflow & Capital Efficiency
Evaluating cash flow and capital efficiency offers insights into AJG's operational robustness and investment returns. Key metrics reveal incremental improvements in cash flow yields and capital allocation marked by prudent management of CAPEX and stock-based compensation.
| Metric | 2022 | 2023 | 2024 |
|---|---|---|---|
| Free Cash Flow Yield | 3.04% | 3.80% | 3.90% |
| Earnings Yield | 2.81% | 2.00% | 2.34% |
| CAPEX to Operating Cash Flow | 13.14% | 9.53% | 5.49% |
| Stock-based Compensation to Revenue | 0.29% | 0.31% | 1.02% |
| Free Cash Flow / Operating Cash Flow Ratio | 86.86% | 90.47% | 94.51% |
AJG displays strong cash flow management, contributing to its capital efficiency, indicative of high operational leverage and a strong propensity for generating excess returns over capital costs.
📉 Balance Sheet & Leverage Analysis
AJG's balance sheet analysis certifies its financial stability with a focus on optimized leverage ratios and liquidity measures to adequately shield against volatility while sustaining operational agility.
| Metric | 2022 | 2023 | 2024 |
|---|---|---|---|
| Debt-to-Equity | 0.702 | 0.772 | 0.668 |
| Debt-to-Assets | 0.167 | 0.161 | 0.210 |
| Debt-to-Capital | 0.412 | 0.436 | 0.401 |
| Net Debt to EBITDA | 2.599 | 3.372 | -0.485 |
| Current Ratio | 1.044 | 1.034 | 1.508 |
| Quick Ratio | 1.044 | 1.034 | 1.508 |
| Financial Leverage | 4.195 | 4.790 | 3.184 |
The metrics delineate AJG's adeptness in effectively structuring its debt, achieving favorable leverage while sufficiently protecting its liquidity buffers, thus fortifying its competitive stance.
✅ Fundamental Strength & Profitability
AJG's profitability indicators serve as a testament to its superior asset management and strategic operational execution. Consistent returns on equity and assets underline its strength in harnessing reinvested capital.
| Metric | 2022 | 2023 | 2024 |
|---|---|---|---|
| Return on Equity | 12.19% | 9.00% | 7.25% |
| Return on Assets | 2.90% | 1.88% | 2.28% |
| Net Margin | 13.03% | 9.63% | 12.65% |
| EBIT Margin | 18.52% | 14.71% | 19.53% |
| EBITDA Margin | 25.54% | 21.63% | 26.81% |
| Gross Margin | 42.07% | 42.15% | 42.22% |
| Research & Development to Revenue | 0% | 0% | 0% |
These profitability dynamics cement AJG's position in the upper echelon of its peer cohort, reflecting astute management decisions directed towards resilience and sustained growth margins.
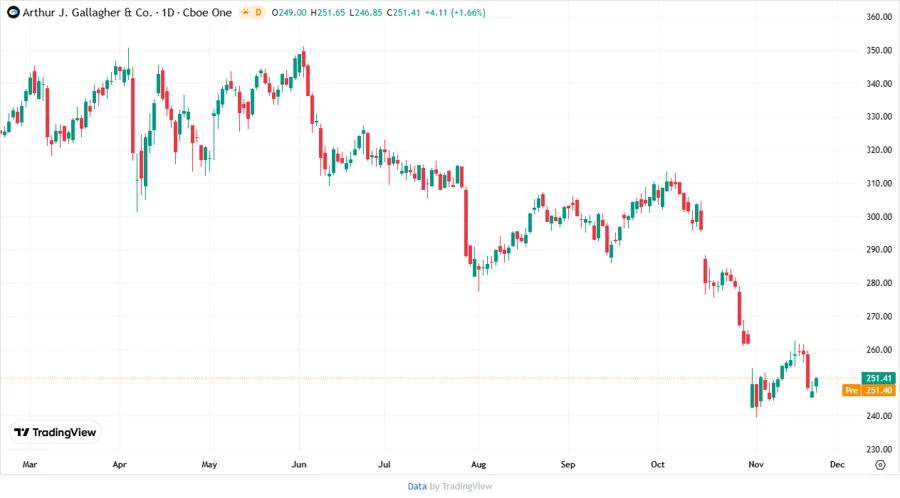
📈 Price Development
📊 Dividend Scoring System
An encapsulated quantitative glimpse of AJG's dividend metrics, reflecting various attributes tending towards investor-friendly characteristics:
| Category | Score | Score Bar |
|---|---|---|
| Dividend Yield | 3 | |
| Dividend Stability | 5 | |
| Dividend Growth | 4 | |
| Payout Ratio | 5 | |
| Financial Stability | 4 | |
| Dividend Continuity | 5 | |
| Cashflow Coverage | 4 | |
| Balance Sheet Quality | 4 |
Overall Score: 34/40
🗣️ Rating
Arthur J. Gallagher & Co. offers an alluring value proposition for dividend investors seeking stability and measured growth. The company has consistently delivered strong financial results, underpinned by prudent fiscal management and strategic operational execution. We recommend AJG as a solid holding for dividend-focused portfolios.
Smart Data Insight
Master the Perfect Entry & Exit for this Stock
Don't leave your profits to chance. Historically, this stock follows specific seasonal patterns that institutional traders use to maximize returns.
- ✅ Identify the "Golden Buying Window"
- ✅ Avoid high-risk correction cycles
- ✅ Backtested data from the last 20+ years