November 15, 2025 a 07:31 am
AJG: Dividend Analysis - Arthur J. Gallagher & Co.
Arthur J. Gallagher & Co. presents a robust dividend profile, reflecting a progressive approach that has bolstered investor confidence over the years. With over four decades of increasing dividends, the company's commitment to its shareholders is evident. The current dividend yield, while modest, signals a stable position conducive for continuous payout growth. Notably, the last dividend cut or suspension occurred over three decades ago, underscoring the reliability of earnings and prudent financial management.
Overview 📊
The financial landscape of Arthur J. Gallagher & Co. is characterized by stability and strategic acumen. The company operates within a risk-averse sector that justifies a dividend yield of 1.01%. With a current dividend per share of $2.38 and an impressive 41-year history of consistent payments, the focus on returning value to shareholders is unquestionable.
| Attribute | Value |
|---|---|
| Sector | Insurance |
| Dividend Yield | 1.01% |
| Current Dividend per Share | $2.38 |
| Dividend History | 41 years |
| Last Cut or Suspension | 1989 |
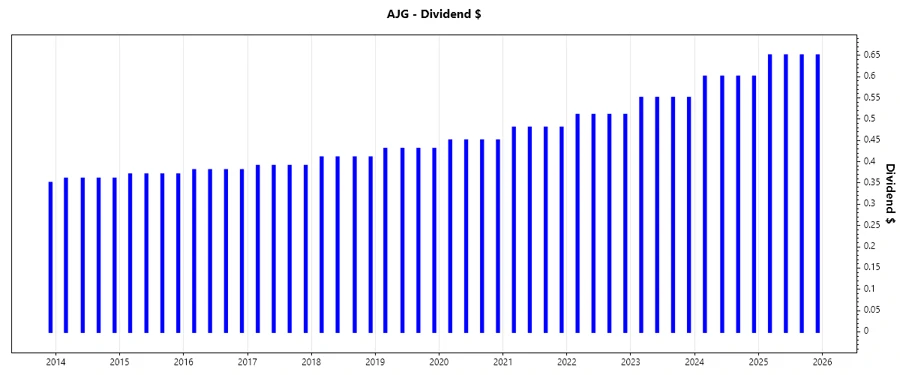
Dividend History 🗣️
Arthur J. Gallagher & Co.'s dividend history is a testament to its reliability and fiscal strength. Over the decades, consistent dividend payouts have fostered trust among investors, reflecting management's commitment to shared prosperity. This historical stability is a critical factor for investors valuing predictability in dividend income.
| Year | Dividend per Share (USD) |
|---|---|
| 2025 | 2.60 |
| 2024 | 2.40 |
| 2023 | 2.20 |
| 2022 | 2.04 |
| 2021 | 1.92 |
Dividend Growth 📈
The growth rate in dividends is a notable aspect of assessing a company's long-term potential to provide higher returns. Over the past three and five years, Arthur J. Gallagher & Co. has demonstrated a commendable growth trajectory in its dividend payouts, reinforcing its strategic financial health.
| Time | Growth |
|---|---|
| 3 years | 7.72% |
| 5 years | 6.89% |
The average dividend growth is 6.89% over 5 years. This shows moderate but steady dividend growth.
Payout Ratio 📉
An analysis of payout ratios is vital in understanding how sustainably a company can pay its dividends. Arthur J. Gallagher & Co. boasts a prudent payout ratio of 37.21% based on EPS and 31.03% based on free cash flow, indicating a comfortable buffer to maintain dividend payments even amidst potential earnings fluctuations.
| Key figure | Ratio |
|---|---|
| EPS-based | 37.21% |
| Free cash flow-based | 31.03% |
The payout ratios reveal a financially sound approach to dividend distribution, where ample earnings coverage ensures continued payouts.
Cashflow & Capital Efficiency ✅
The essence of any investment lies in the ability to generate sustainable cash flows alongside capital efficiency. Arthur J. Gallagher & Co. exhibits impressive cash flow yields and capital utilization ratios, verifying its strong operational framework and investment viability.
| Year | 2024 | 2023 | 2022 |
|---|---|---|---|
| Free Cash Flow Yield | 3.90% | 3.80% | 3.04% |
| Earnings Yield | 2.34% | 2.01% | 2.81% |
| CAPEX to Operating Cash Flow | 5.49% | 9.53% | 13.14% |
| Stock-based Compensation to Revenue | 1.02% | 0.31% | 0.29% |
| Free Cash Flow / Operating Cash Flow Ratio | 94.51% | 90.47% | 86.86% |
The cash flow metrics reveal a solid foundation for capital efficiency, ensuring that operational earnings sufficiently cover capital expenditures and stakeholder returns.
Balance Sheet & Leverage Analysis ⚠️
Understanding the leverage and balance sheet health of Arthur J. Gallagher & Co. is essential in assessing its financial robustness. With sound debt ratios and leverage metrics, the company demonstrates fiscal discipline while strategically managing its capital structure.
| Year | 2024 | 2023 | 2022 |
|---|---|---|---|
| Debt-to-Equity | 0.668 | 0.772 | 0.702 |
| Debt-to-Assets | 0.210 | 0.161 | 0.167 |
| Debt-to-Capital | 0.401 | 0.436 | 0.412 |
| Net Debt to EBITDA | -0.485 | 3.372 | 2.600 |
| Current Ratio | 1.508 | 1.034 | 1.044 |
| Quick Ratio | 1.508 | 1.034 | 1.044 |
| Financial Leverage | 3.184 | 4.790 | 4.195 |
The leveraged position appears well-managed, ensuring financial flexibility while underscoring investment-grade creditworthiness.
Fundamental Strength & Profitability 🏅
Profitability and fundamental strength are core indicators of a company's potential for sustained success. Arthur J. Gallagher & Co.'s profitability ratios highlight its operational efficiency, strategic prowess in resource allocation, and a robust revenue base.
| Year | 2024 | 2023 | 2022 |
|---|---|---|---|
| Return on Equity | 7.25% | 9.00% | 12.19% |
| Return on Assets | 2.28% | 1.88% | 2.90% |
| Return on Invested Capital | 5.05% | 7.05% | 7.98% |
| Net Margin | 12.66% | 9.63% | 13.03% |
| EBIT Margin | 19.53% | 14.71% | 18.52% |
| EBITDA Margin | 26.81% | 21.63% | 25.54% |
| Gross Margin | 42.22% | 42.15% | 42.07% |
| R&D to Revenue | 0% | 0% | 0% |
The profitability indicators suggest robust financial health and a well-executed strategy, ensuring continued returns and operational success.
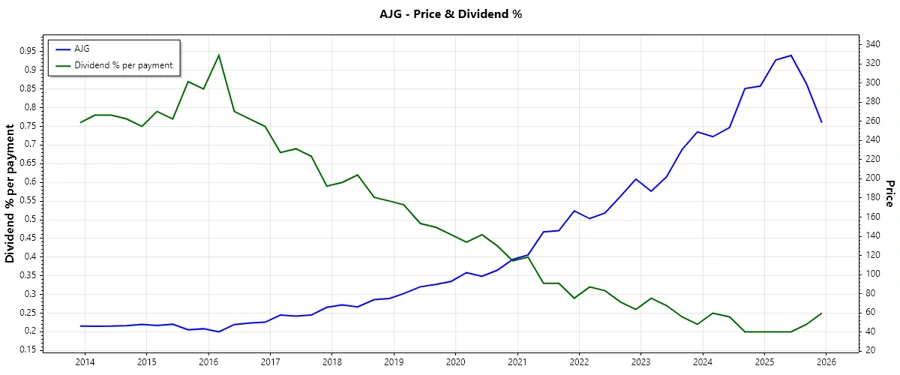
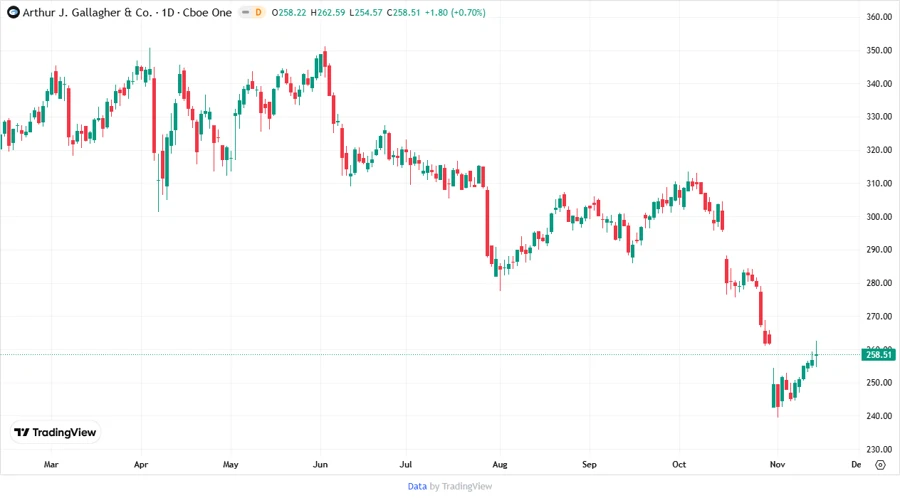
Price Development 💹
Dividend Scoring System ✅
| Criterion | Score |
|---|---|
| Dividend yield | 3 |
| Dividend Stability | 5 |
| Dividend growth | 4 |
| Payout ratio | 4 |
| Financial stability | 5 |
| Dividend continuity | 5 |
| Cashflow Coverage | 4 |
| Balance Sheet Quality | 4 |
Overall Score: 34/40
Rating ⭐
Arthur J. Gallagher & Co. exemplifies a robust dividend profile supported by financial stability and dynamic growth strategies. The well-maintained dividend history and prudent financial management make it a reliable choice for income-focused investors seeking consistent returns.
Smart Data Insight
Master the Perfect Entry & Exit for this Stock
Don't leave your profits to chance. Historically, this stock follows specific seasonal patterns that institutional traders use to maximize returns.
- ✅ Identify the "Golden Buying Window"
- ✅ Avoid high-risk correction cycles
- ✅ Backtested data from the last 20+ years