August 18, 2025 a 03:32 pm


AJG: Dividend Analysis - Arthur J. Gallagher & Co.
The dividend profile of Arthur J. Gallagher & Co. demonstrates a solid commitment to shareholder returns, evidenced by its 41-year history of payouts. With a current dividend yield of 0.87%, shareholders enjoy consistent returns. However, a deep dive into the financials reveals insights into the sustainability and growth potential of these dividends.
📊 Overview
Arthur J. Gallagher & Co. stands out in the financial sector due to its long-standing dividend history. However, the relatively low yield might not offer immediate attraction for high-yield seekers.
| Metric | Value |
|---|---|
| Sector | Financial |
| Dividend yield | 0.87% |
| Current dividend per share | 2.38 USD |
| Dividend history | 41 years |
| Last cut or suspension | None |
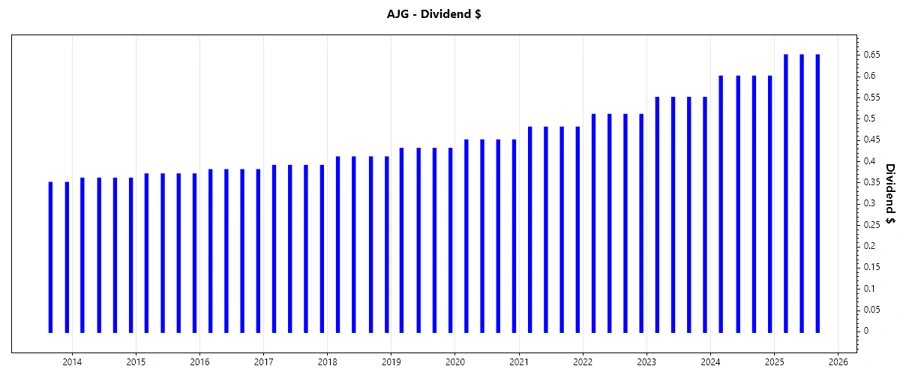
📉 Dividend History
Having maintained a steady dividend payout over 41 years, Arthur J. Gallagher & Co. demonstrates reliability and consistent shareholder value—which is paramount for income-focused investors.
| Year | Dividend per Share (USD) |
|---|---|
| 2025 | 1.95 |
| 2024 | 2.4 |
| 2023 | 2.2 |
| 2022 | 2.04 |
| 2021 | 1.92 |
📈 Dividend Growth
Dividend growth is essential as it reflects a company's ability to enhance shareholder value. Over the past three to five years, Arthur J. Gallagher & Co. has demonstrated moderate yet steady growth in dividend distributions.
| Time | Growth |
|---|---|
| 3 years | 7.72% |
| 5 years | 6.89% |
The average dividend growth is 6.89% over 5 years. This shows moderate but steady dividend growth.
🗣️ Payout Ratio
A low payout ratio usually indicates that the dividend is sustainable. Arthur J. Gallagher & Co.’s current ratios suggest its dividend policy is well-covered by both earnings and free cash flows.
| Key figure | Ratio |
|---|---|
| EPS-based | 37.21% |
| Free cash flow-based | 30.98% |
The respective EPS and FCF payout ratios (37.21% and 30.98%) are favorable, indicating robust dividend coverage.
✅ Cashflow & Capital Efficiency
Consistent cash flows and efficient capital allocation are crucial for long-term dividend sustainability. Here’s a look at the recent trends:
| Metric | 2024 | 2023 | 2022 |
|---|---|---|---|
| Free Cash Flow Yield | 3.90% | 3.80% | 4.90% |
| Earnings Yield | 2.34% | 2.01% | 2.81% |
| CAPEX to Operating Cash Flow | 5.49% | 9.53% | 8.60% |
| Stock-based Compensation to Revenue | 1.02% | 0.31% | 0.29% |
| Free Cash Flow / Operating Cash Flow Ratio | 94.51% | 90.47% | 91.40% |
Capital efficiency metrics indicate solid free cash flow generation, aiding in sustaining dividends.
⚠️ Balance Sheet & Leverage Analysis
A healthy balance sheet underpins a company’s ability to maintain and potentially increase dividend payments. Arthur J. Gallagher & Co.’s leverage and liquidity measures are as follows:
| Metric | 2024 | 2023 | 2022 |
|---|---|---|---|
| Debt-to-Equity | 0.67 | 0.77 | 0.70 |
| Debt-to-Assets | 0.21 | 0.16 | 0.16 |
| Debt-to-Capital | 0.40 | 0.44 | 0.41 |
| Net Debt to EBITDA | -0.48 | 3.37 | 2.78 |
| Current Ratio | 1.51 | 1.03 | 1.04 |
| Quick Ratio | 1.51 | 1.03 | 0.83 |
| Financial Leverage | 3.18 | 4.79 | 4.26 |
The leverage profile suggests a well-managed debt structure, important for sustaining future dividends.
📌 Fundamental Strength & Profitability
Strong fundamental and profitability ratios are critical indicators of a company's ability to both sustain and grow dividends:
| Metric | 2024 | 2023 | 2022 |
|---|---|---|---|
| Return on Equity | 7.25% | 8.99% | 12.19% |
| Return on Assets | 2.28% | 1.88% | 2.86% |
| Net Margin | 12.66% | 9.63% | 13.03% |
| EBIT Margin | 19.75% | 14.71% | 18.52% |
| EBITDA Margin | 27.04% | 21.63% | 25.54% |
| Gross Margin | 84.82% | 42.15% | 42.07% |
| Research & Development to Revenue | 0% | 0% | 0% |
Overall, profitability metrics indicate potential for stable dividends with room for growth.
💹 Price Development
✅ Dividend Scoring System
| Criteria | Score | |
|---|---|---|
| Dividend yield | 3 | |
| Dividend Stability | 5 | |
| Dividend growth | 3 | |
| Payout ratio | 4 | |
| Financial stability | 4 | |
| Dividend continuity | 5 | |
| Cashflow Coverage | 4 | |
| Balance Sheet Quality | 4 |
Total Score: 32/40
🗣️ Rating
Arthur J. Gallagher & Co. presents an appealing proposition for dividend investors, particularly due to its exceptional dividend stability and continuity. While the yield is on the lower end, the sustainable payout ratios and solid financial underpinnings suggest potential for long-term growth and stability in returns. Investment consideration is recommended for those valuing durable income combined with incremental growth.
Smart Data Insight
Master the Perfect Entry & Exit for this Stock
Don't leave your profits to chance. Historically, this stock follows specific seasonal patterns that institutional traders use to maximize returns.
- ✅ Identify the "Golden Buying Window"
- ✅ Avoid high-risk correction cycles
- ✅ Backtested data from the last 20+ years