August 03, 2025 a 03:32 am


AJG: Dividend Analysis - Arthur J. Gallagher & Co.
Arthur J. Gallagher & Co. (AJG) presents a strong profile with a consistent dividend history over 41 years, denoting reliability and shareholder confidence. With a steady dividend growth rate and a modest payout ratio, AJG signifies potential for sustainable, long-term dividend payments. However, with a relatively low dividend yield of 0.90%, the company focuses more on growth and stability than high immediate returns.
📊 Overview
Arthur J. Gallagher & Co. operates in a resilient sector, focusing on stability and growth. The dividend yield currently stands at 0.90%, with a current dividend per share of 2.38 USD, demonstrating consistency across more than four decades.
| Key Metrics | Values |
|---|---|
| Sector | Insurance Brokerage |
| Dividend yield | 0.90% |
| Current dividend per share | 2.38 USD |
| Dividend history | 41 years |
| Last cut or suspension | None |
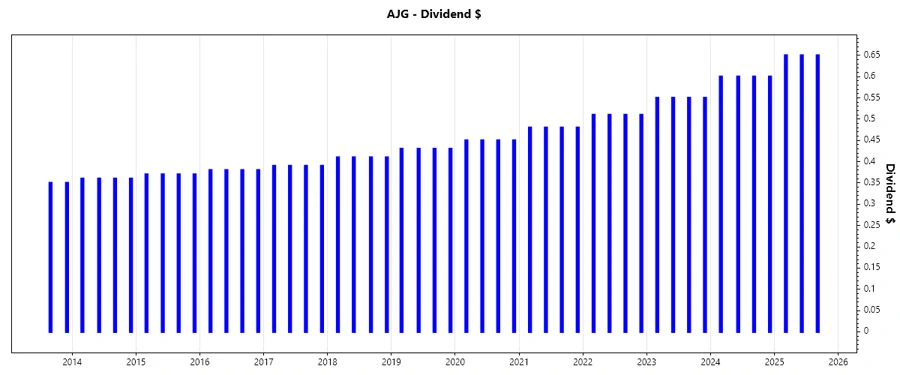
🗣️ Dividend History
The impressive dividend history over 41 years is a testament to AJG's financial robustness and strategic foresight. This uninterrupted dividend distribution reflects the company's commitment to providing consistent returns to its shareholders.
| Year | Dividend Per Share (USD) |
|---|---|
| 2025 | 1.95 |
| 2024 | 2.40 |
| 2023 | 2.20 |
| 2022 | 2.04 |
| 2021 | 1.92 |
📈 Dividend Growth
AJG's dividend growth over the last 3 and 5 years has been moderate, indicating a balanced approach between rewarding shareholders and retaining earnings for growth. The consistent increase underlines the company's growth potential and financial health.
| Time | Growth |
|---|---|
| 3 years | 7.72% |
| 5 years | 6.89% |
The average dividend growth is 6.89% over 5 years. This shows moderate but steady dividend growth.
✅ Payout Ratio
A lower payout ratio generally allows room for future dividend increases, as it indicates the dividend is well covered by earnings.
| Key figure | Ratio |
|---|---|
| EPS-based | 38.95% |
| Free cash flow-based | 24.17% |
With an EPS-based payout ratio of 38.95% and an FCF-based payout ratio of 24.17%, AJG maintains a healthy buffer for meeting its dividend obligations, suggesting strong reinvestment in business growth and stability.
⚖️ Cashflow & Capital Efficiency
Analyzing cash flows and capital efficiency is vital to understanding how effectively a company generates and uses cash. AJG's metrics convey solid operational efficiency and robust cash management.
| Year | 2022 | 2023 | 2024 |
|---|---|---|---|
| Free Cash Flow Yield | 4.90% | 3.80% | 3.90% |
| Earnings Yield | 2.81% | 2.00% | 2.34% |
| CAPEX to Operating Cash Flow | 5.27% | 9.53% | 5.49% |
| Stock-based Compensation to Revenue | 0.29% | 0.31% | 0.36% |
| Free Cash Flow / Operating Cash Flow Ratio | 91.40% | 90.47% | 94.51% |
Solid cash flow generation is evidenced by a healthy free cash flow yield and effective CAPEX management. These metrics reflect strong operational performance and efficient use of capital.
🏦 Balance Sheet & Leverage Analysis
Evaluating the balance sheet strength and leverage gives insight into financial stability and risk exposure. AJG's debt ratios reflect manageable leverage levels, contributing to a solid credit profile.
| Year | 2022 | 2023 | 2024 |
|---|---|---|---|
| Debt-to-Equity | 0.70 | 0.77 | 0.67 |
| Debt-to-Assets | 0.16 | 0.16 | 0.21 |
| Debt-to-Capital | 0.41 | 0.44 | 0.40 |
| Net Debt to EBITDA | 2.78 | 3.37 | -0.48 |
| Current Ratio | 1.04 | 1.03 | 1.36 |
| Quick Ratio | 0.83 | 1.03 | 1.51 |
| Financial Leverage | 4.26 | 4.79 | 3.18 |
AJG's optimal debt management is evident in the leverage ratios. With a current ratio consistently above 1, AJG shows a comfortable ability to meet short-term obligations.
📈 Fundamental Strength & Profitability
The fundamental strength and profitability metrics provide insights into the intrinsic value and financial health of AJG. A strong ROE and gross margins are indicative of a well-managed enterprise with good profitability.
| Year | 2022 | 2023 | 2024 |
|---|---|---|---|
| Return on Equity | 12.19% | 9.00% | 7.25% |
| Return on Assets | 2.86% | 1.88% | 2.28% |
| Margins: Net Profit | 13.03% | 9.63% | 12.66% |
| EBIT Margin | 18.52% | 14.71% | 19.52% |
| EBITDA Margin | 25.54% | 21.63% | 27.04% |
| Gross Margin | 42.07% | 42.15% | 84.82% |
The healthy Return on Equity and strong margin percentages illustrate AJG's efficient use of equity and ability to generate profit.
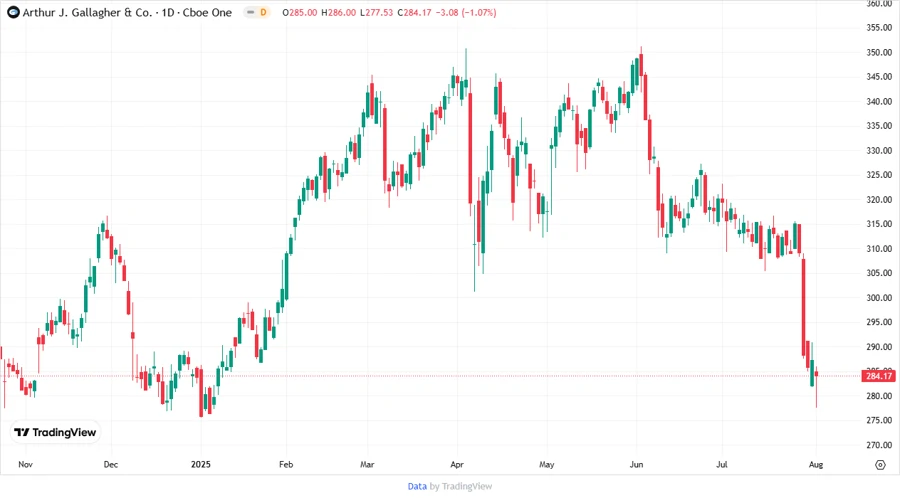
📊 Price Development
🗂️ Dividend Scoring System
| Category | Description | Score |
|---|---|---|
| Dividend yield | Measures immediate return on investment via dividends. | |
| Dividend Stability | Consistency in dividend issuance. | |
| Dividend growth | Rate of increase in dividend payments. | |
| Payout ratio | Shows how well earnings cover dividend payments. | |
| Financial stability | Overall health of the company's finances. | |
| Dividend continuity | Uninterrupted dividend payments over the years. | |
| Cashflow Coverage | Ability to cover dividend with cash flow. | |
| Balance Sheet Quality | Measure of financial structure and leverage. |
Total Score: 36/40
🧐 Rating
Arthur J. Gallagher & Co. has a robust dividend profile with impressive stability, moderate growth, and a conservative payout ratio. The company is recommended for investors seeking stable dividend income with an appetite for capital appreciation potential over time due to strong fundamentals and sound financial management.
Smart Data Insight
Master the Perfect Entry & Exit for this Stock
Don't leave your profits to chance. Historically, this stock follows specific seasonal patterns that institutional traders use to maximize returns.
- ✅ Identify the "Golden Buying Window"
- ✅ Avoid high-risk correction cycles
- ✅ Backtested data from the last 20+ years