June 17, 2025 a 03:31 pm


AJG: Dividend Analysis - Arthur J. Gallagher & Co.
Arthur J. Gallagher & Co., a resilient player in the financial sector, demonstrates a solid dividend history spanning over four decades. Despite a modest dividend yield, the company's consistent payout and growth make it an attractive option for long-term investors seeking stability. Its low payout ratios suggest a sustainable dividend policy.
📊 Overview
| Metric | Value |
|---|---|
| Sector | Financial |
| Dividend yield | 0.76% |
| Current dividend per share | 2.38 USD |
| Dividend history | 41 years |
| Last cut or suspension | None |
This information substantiates the company's reputation for consistent and stable dividend payments, vital for income-focused investors.
📈 Dividend History
Arthur J. Gallagher & Co.'s dividend history showcases its commitment to shareholder returns, a critical indicator for evaluating the company's financial health and shareholder alignment.
| Year | Dividend per Share (USD) |
|---|---|
| 2025 | 1.30 |
| 2024 | 2.40 |
| 2023 | 2.20 |
| 2022 | 2.04 |
| 2021 | 1.92 |
📉 Dividend Growth
Examining dividend growth is crucial for prospective income as it reflects the firm's ability to enhance shareholder value. The average dividend growth over five years demonstrates a moderate but steady increase, indicating a reliable income stream for investors.
| Time | Growth |
|---|---|
| 3 years | 7.72% |
| 5 years | 6.89% |
The average dividend growth is 6.89% over 5 years. This shows moderate but steady dividend growth.
🗣️ Payout Ratio
Payout ratios evaluate the sustainability of dividends by illustrating the percentage of earnings or cash flows distributed as dividends. Lower ratios often indicate a company's capacity to endure economic downturns while maintaining payouts.
| Key figure | Ratio |
|---|---|
| EPS-based | 34.61% |
| Free Cash Flow-based | 24.17% |
The EPS payout ratio of 34.61% and FCF payout ratio of 24.17% suggest strong coverage and the potential for future enhancements in dividend payouts.
📊 Cashflow & Capital Efficiency
Strong cash flows and capital efficiency ensure a firm's ability to cover dividends and reinvest in growth opportunities. Evaluating these metrics is vital for understanding long-term financial health and strategic flexibility.
| Year | 2024 | 2023 | 2022 |
|---|---|---|---|
| Free Cash Flow Yield | 3.91% | 3.80% | 4.90% |
| Earnings Yield | 2.34% | 2.01% | 2.81% |
| CAPEX to Operating Cash Flow | 5.27% | 9.53% | 8.60% |
| Stock-based Compensation to Revenue | 0.36% | 0.31% | 0.29% |
| Free Cash Flow / Operating Cash Flow Ratio | 94.51% | 90.47% | 91.40% |
Arthur J. Gallagher & Co.'s robust cash flow metrics and capital efficiency indicate strong potential for sustaining dividend payouts and pursuing strategic investments.
⚖️ Balance Sheet & Leverage Analysis
Analyzing a firm's balance sheet and leverage provides insight into financial stability, liquidity, and the ability to withstand economic challenges without impacting dividend policies.
| Year | 2024 | 2023 | 2022 |
|---|---|---|---|
| Debt-to-Equity | 0.67 | 0.77 | 0.70 |
| Debt-to-Assets | 0.21 | 0.16 | 0.16 |
| Debt-to-Capital | 0.40 | 0.44 | 0.41 |
| Net Debt to EBITDA | -0.48 | 3.37 | 2.78 |
| Current Ratio | 1.51 | 1.03 | 1.04 |
| Quick Ratio | 1.51 | 1.03 | 0.83 |
| Financial Leverage | 3.18 | 4.79 | 4.26 |
The firm's balance sheet stability and manageable leverage ratios suggest it is well-positioned to uphold its financial commitments and dividend strategies.
🧲 Fundamental Strength & Profitability
Profitability ratios reveal the firm’s operational effectiveness and return on investments, crucial for evaluating potential growth and dividend prospects.
| Year | 2024 | 2023 | 2022 |
|---|---|---|---|
| Return on Equity | 7.25% | 8.99% | 12.19% |
| Return on Assets | 2.28% | 1.88% | 2.86% |
| Margins: Net | 12.66% | 9.63% | 13.03% |
| EBIT | 19.53% | 14.71% | 18.52% |
| EBITDA | 27.04% | 21.63% | 25.54% |
| Gross | 84.82% | 42.15% | 42.07% |
| R&D to Revenue | 0% | 0% | 0% |
Arthur J. Gallagher & Co.'s profitability metrics reflect operational efficiency and a favorable return on equity, supporting continued dividend growth potential.
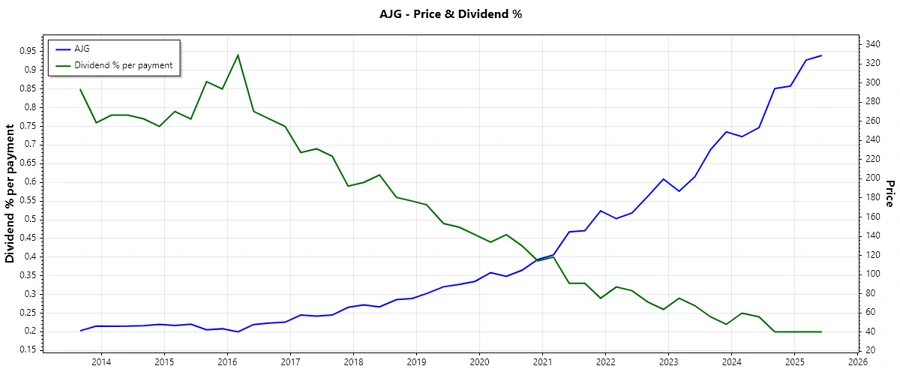
✅ Price Development
🏆 Dividend Scoring System
| Category | Description | Score |
|---|---|---|
| Dividend yield | Low yield, stable history | |
| Dividend Stability | Consistent 41 years | |
| Dividend Growth | Moderate, steady | |
| Payout Ratio | Well-covered dividends | |
| Financial Stability | Strong balance sheet | |
| Dividend Continuity | No cuts, reliable | |
| Cashflow Coverage | High coverage ratio | |
| Balance Sheet Quality | Low leverage |
35/40
📜 Rating
Arthur J. Gallagher & Co. presents a compelling case for stable, long-term investors. The strong dividend continuity, robust balance sheet, and healthy payout ratios indicate a reliably growing income stream, making it a prudent choice for those prioritizing consistent dividend income over higher yield but riskier alternatives.
Smart Data Insight
Master the Perfect Entry & Exit for this Stock
Don't leave your profits to chance. Historically, this stock follows specific seasonal patterns that institutional traders use to maximize returns.
- ✅ Identify the "Golden Buying Window"
- ✅ Avoid high-risk correction cycles
- ✅ Backtested data from the last 20+ years