May 17, 2026 a 09:03 am
AIZ: Trend and Support & Resistance Analysis - Assurant, Inc.
Assurant, Inc. (AIZ) has shown resilience and adaptability in providing consumer-focused solutions through its Global Lifestyle and Global Housing segments. The recent stock price movements reflect both the company's market positioning and external economic influences. Understanding the emerging trends and key support and resistance areas is crucial for wise investment decisions.
Trend Analysis
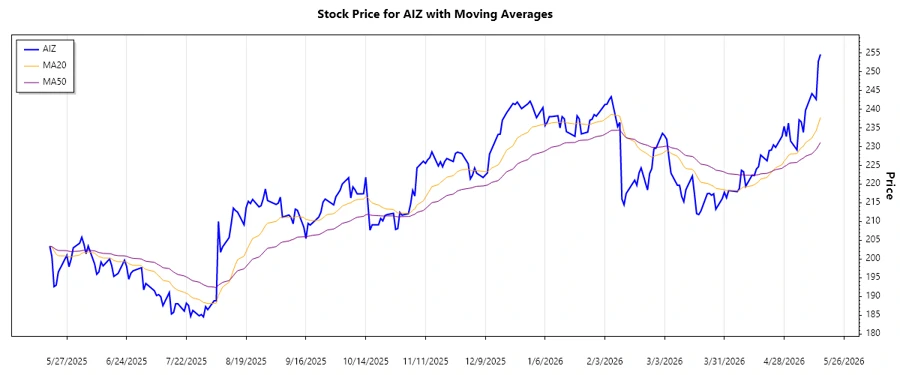
Through careful examination of the recent stock performance of Assurant, Inc. (AIZ), a notable upward trend has been identified based on the calculated exponential moving averages (EMAs). The EMA20 has surpassed the EMA50, indicating a bullish outlook for traders and investors.
| Date | Close Price | Trend |
|---|---|---|
| 2026-05-15 | 254.61 | ▲ |
| 2026-05-14 | 252.72 | ▲ |
| 2026-05-13 | 242.61 | ▲ |
| 2026-05-12 | 243.43 | ▲ |
| 2026-05-11 | 244.14 | ▲ |
| 2026-05-08 | 239.67 | ▲ |
| 2026-05-07 | 233.8 | ▲ |
The consistent upward trend in the prices indicates favorable market conditions and potential for further growth.
Support and Resistance
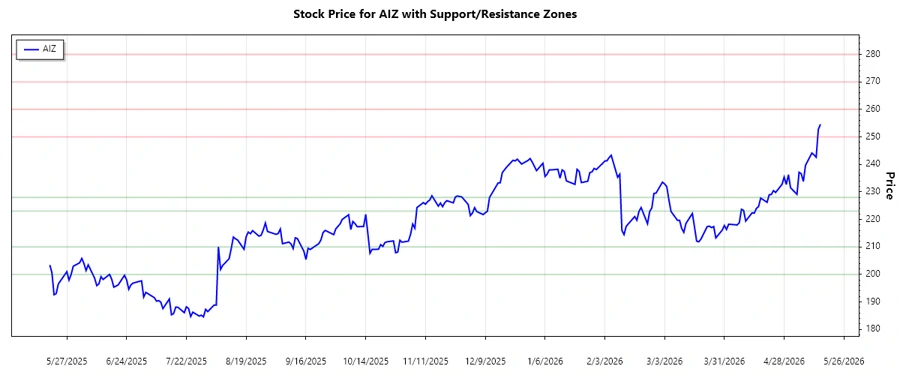
Recent analysis of Assurant, Inc. (AIZ) has revealed two major support zones and resistance levels that could play a crucial role in upcoming price movements. The identification of these zones helps traders prepare for potential market reversals or breakouts.
| Zone Type | From | To |
|---|---|---|
| Support 1 | 223.00 | 228.00 |
| Support 2 | 200.00 | 210.00 |
| Resistance 1 | 250.00 | 260.00 |
| Resistance 2 | 270.00 | 280.00 |
Currently, the stock price sits between the first resistance zone which could challenge its upward momentum if not breached.
Conclusion
Assurant, Inc. (AIZ) demonstrates promising investment opportunities with its upward price momentum and clear support and resistance levels. Despite current economic uncertainties, the company’s robust business model within the lifestyle and housing sectors positions it well for future growth. Investors should monitor these technical levels closely. Potential risks include changes in market dynamics that could test identified support levels.
Smart Data Insight
Master the Perfect Entry & Exit for this Stock
Don't leave your profits to chance. Historically, this stock follows specific seasonal patterns that institutional traders use to maximize returns.
- ✅ Identify the "Golden Buying Window"
- ✅ Avoid high-risk correction cycles
- ✅ Backtested data from the last 20+ years