February 03, 2026 a 03:15 am
AIZ: Trend and Support & Resistance Analysis - Assurant, Inc.
Assurant, Inc., a key player in the lifestyle and housing solutions industry, has demonstrated resiliency through strategic positioning in various markets. With a diversified portfolio and strong market presence, the company remains a competitive force in the insurance and service industry. The current technical analysis offers insights into potential future movements crucial for investors and traders.
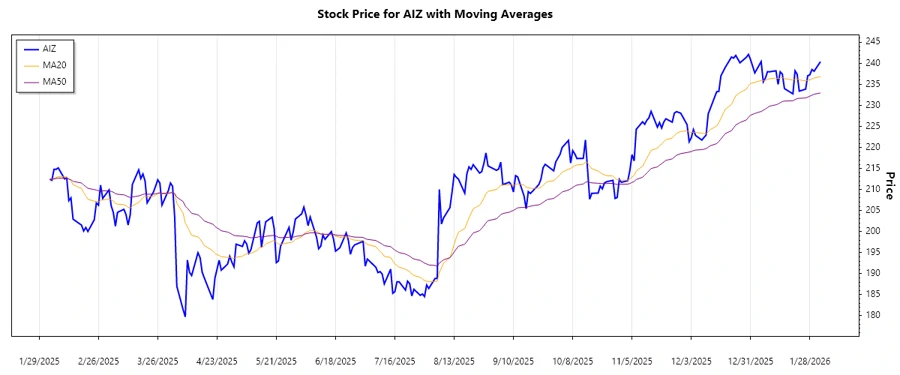
Trend Analysis
Based on the calculated EMAs, the stock is currently showing an upward trend, confirming investor confidence.
| Date | Closing Price | Trend |
|---|---|---|
| 2026-02-02 | 240.39 | ▲ Up |
| 2026-01-30 | 238.13 | ▲ Up |
| 2026-01-29 | 238.54 | ⚖️ Sideways |
| 2026-01-28 | 237.29 | ⚖️ Sideways |
| 2026-01-27 | 237.05 | ⚖️ Sideways |
| 2026-01-26 | 233.87 | ▼ Down |
| 2026-01-23 | 233.39 | ▼ Down |
This trend can be interpreted as a sign that the stock's bullish sentiment might continue, given no major disruptions occur.
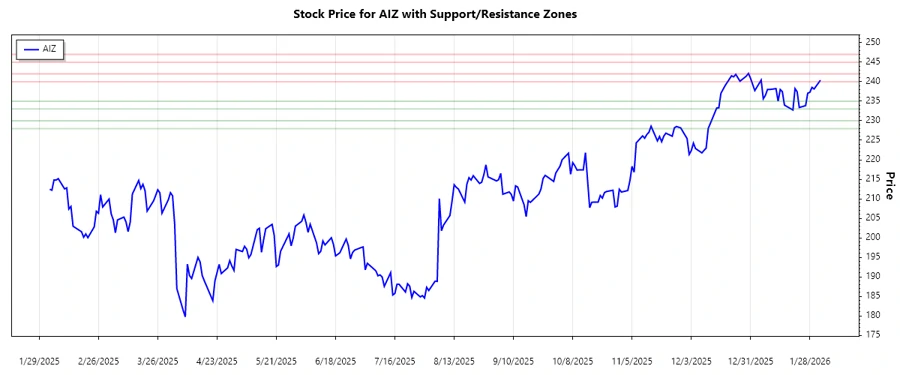
Support and Resistance
The key support and resistance levels indicate potential areas where price adjustments may occur.
| Zone Type | Zone Range |
|---|---|
| Support Zone 1 | 233.00 - 235.00 |
| Support Zone 2 | 228.00 - 230.00 |
| Resistance Zone 1 | 240.00 - 242.00 |
| Resistance Zone 2 | 245.00 - 247.00 |
The current price is within a crucial resistance zone, which could signal a breakthrough or a reversal.
Conclusion
Assurant, Inc. currently shows a positive market sentiment with potential growth as indicated by the upward trend and strategic market positioning. However, the proximity to resistance levels gives a cautious note that reversals are possible. A tight watch on the market sentiment and industry developments is warranted. The analysis suggests potential good performance if the current conditions persist, yet market volatility remains a factor to consider. Investment decisions should weigh these technical insights against broader market conditions.