October 12, 2025 a 01:15 pm
AIZ: Trend and Support & Resistance Analysis - Assurant, Inc.
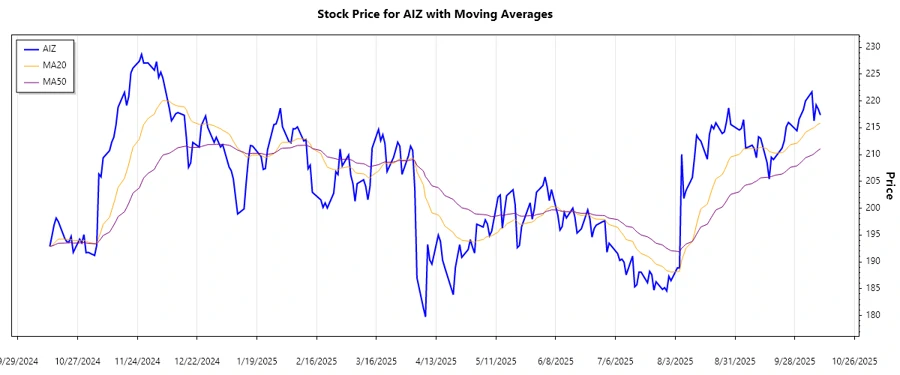
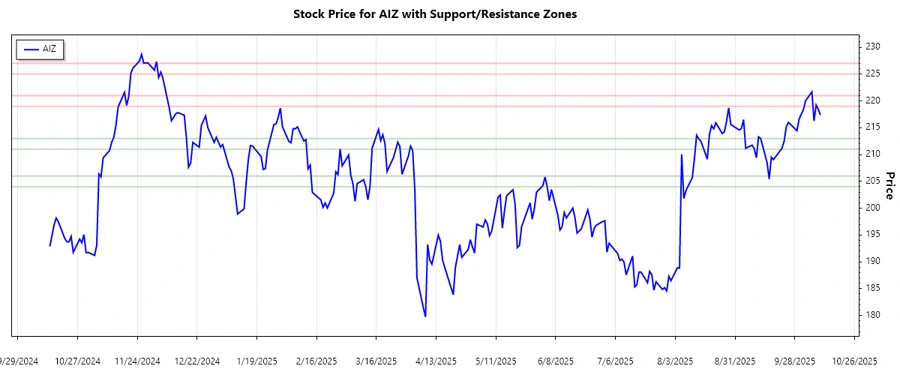
Assurant, Inc. has experienced a dynamic price movement over the recent months, reflecting the changing market conditions in its lifestyle and housing solutions domains. The stock has shown resilience in the face of broader market volatility. Investors may find potential opportunities as the price navigates through its identified support and resistance levels, alongside its current trend dynamics.
Trend Analysis
| Date | Closing Price | Trend |
|---|---|---|
| 2025-10-10 | 217.37 | ⚖️ |
| 2025-10-09 | 218.45 | ⚖️ |
| 2025-10-08 | 219.26 | ⚖️ |
| 2025-10-07 | 216.29 | ⚖️ |
| 2025-10-06 | 221.69 | ⚖️ |
| 2025-10-03 | 220.00 | ⚖️ |
| 2025-10-02 | 218.36 | ⚖️ |
The EMA20 and EMA50 are closely aligned, suggesting a neutral or sideways trend over the past few weeks. This indicates indecision in the market where neither bulls nor bears have dominance.
Support- and Resistance
| Zone | Range | Indicator |
|---|---|---|
| Support Zone 1 | 211.00 - 213.00 | 🔽 |
| Support Zone 2 | 204.00 - 206.00 | 🔽 |
| Resistance Zone 1 | 219.00 - 221.00 | 🔼 |
| Resistance Zone 2 | 225.00 - 227.00 | 🔼 |
The current price of 217.37 is situated just below the primary resistance zone of 219.00 - 221.00, indicating a potential challenge for upward movement. However, if breached, it could open doors to higher resistance levels.
Conclusion
Assurant, Inc. is showing signs of a consolidating trend, indicating potential shifts in investor sentiment. With both support and resistance levels well-established, market participants should monitor for breakout signals. Should the price break above resistance, it could suggest a more bullish outlook. Conversely, a descent into support zones may reflect bearish sentiment. Investors should weigh these dynamics against larger market conditions and company-specific news that could influence future price movements.
Smart Data Insight
Master the Perfect Entry & Exit for this Stock
Don't leave your profits to chance. Historically, this stock follows specific seasonal patterns that institutional traders use to maximize returns.
- ✅ Identify the "Golden Buying Window"
- ✅ Avoid high-risk correction cycles
- ✅ Backtested data from the last 20+ years