September 14, 2025 a 04:03 am


AIZ: Trend and Support & Resistance Analysis - Assurant, Inc.
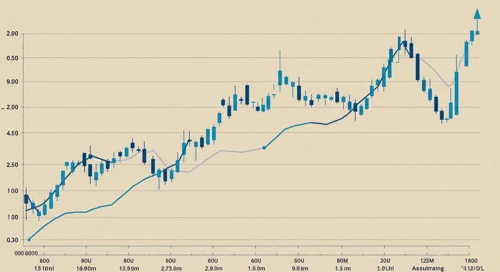
The recent performance of Assurant, Inc. (AIZ) reveals a gradual uptrend with consistent movement in price, supported by strong fundamentals in housing and lifestyle solutions. With a diverse portfolio and strong market presence, Assurant is poised for continued growth in North America and beyond.
Trend Analysis
The trend analysis is based on the Exponential Moving Averages (EMA) calculated over 20 and 50 days respectively. The recent days show a significant price movement with the following details:
| Date | Close Price | Trend Indicator |
|---|---|---|
| 2025-09-12 | 213.01 | ▲ |
| 2025-09-11 | 213.31 | ▲ |
| 2025-09-10 | 209.40 | ▼ |
| 2025-09-09 | 211.10 | ▲ |
| 2025-09-08 | 211.75 | ▲ |
| 2025-09-05 | 211.17 | ▼ |
| 2025-09-04 | 216.51 | ▲ |
Based on the EMA indicator, an upward trend is observed as the EMA20 is above EMA50. This suggests potential bullish momentum.
Support- and Resistance
Support and resistance levels indicate key zones that may impact price movement:
| Zone Type | From | To |
|---|---|---|
| Support | 210 | 212 ▲ |
| Support | 198 | 200 ▲ |
| Resistance | 220 | 222 ▼ |
| Resistance | 230 | 232 ▼ |
Currently, the stock price is hovering around the support zone, indicating potential buy opportunities if upwards momentum continues.
Conclusion
The Assurant, Inc. stock (AIZ) shows a sustained uptrend propelled by increasing market demand in its key segments. With the current price exhibiting stability around a significant support zone, investors might find opportunities for entry. However, caution should be applied as resistance zones above could potentially limit upward movement. With a firm market strategy and global reach, Assurant continues to present both growth potential and investment risks depending on broader economic conditions.
Smart Data Insight
Master the Perfect Entry & Exit for this Stock
Don't leave your profits to chance. Historically, this stock follows specific seasonal patterns that institutional traders use to maximize returns.
- ✅ Identify the "Golden Buying Window"
- ✅ Avoid high-risk correction cycles
- ✅ Backtested data from the last 20+ years