January 31, 2026 a 03:15 pm

AIZ: Fibonacci Analysis - Assurant, Inc.
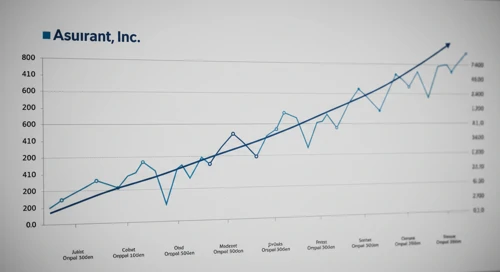
Assurant, Inc., a significant player in the lifestyle and housing solutions sector, shows diverse service offerings since its establishment in 1892. Analyzed stock data indicates a notable upward trend recently. Despite market fluctuations, Assurant demonstrates robustness due to its diversified segments in Global Lifestyle and Global Housing. This analysis aims to uncover potential support and resistance levels utilizing Fibonacci Retracement.
Fibonacci Analysis
This Fibonacci analysis evaluates the recent upward trend of Assurant, Inc.'s stock.
| Analysis Element | Details |
|---|---|
| Trend Duration | From: 2025-08-04 to 2026-01-05 |
| High Point | 242.13 on 2025-12-30 |
| Low Point | 186.48 on 2025-08-01 |
| Fibonacci Levels |
|
| Current Price Position | In 0.786 Retracement Zone |
| Interpretation | The stock is testing the 0.786 retracement level, which may serve as strong support, suggesting a potential bullish continuation if maintained. |
Conclusion
The recent upward trend in Assurant, Inc. signifies a resilient performance amidst varied market conditions. The current testing of the 0.786 retracement level could act as critical support. If the price sustains beyond this threshold, it may indicate further upside potential. Analysts should consider this retracement level as a pivotal point for medium to long-term investment decisions. Though opportunities for growth exist, breaking below critical support levels may alter the outlook, necessitating adjustments to investment strategies. Assurant's growth prospects remain promising, supported by its well-established service sectors and geographical market presence.