November 11, 2025 a 10:15 am
AIZ: Fibonacci Analysis - Assurant, Inc.
Assurant, Inc., a leading provider in lifestyle and housing solutions, has demonstrated strong resilience across global markets. The company's diverse portfolio in mobile devices and housing insurance positions it well against economic volatilities. Recent price movements highlight a dominant uptrend which could be an opportunity for investors seeking long-term value. This analysis will explore the potential price retracements using Fibonacci levels to predict future movements in the stock price.
Fibonacci Analysis
| Trend Start Date | Trend End Date | High Price/Date | Low Price/Date | Fibonacci Levels |
|---|---|---|---|---|
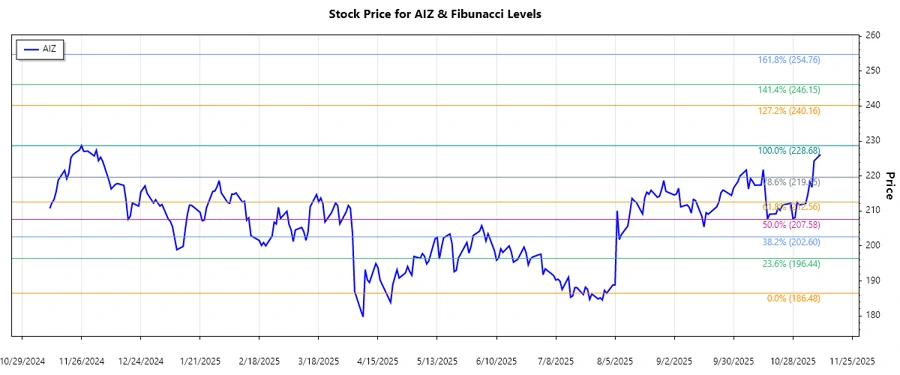
| 2024-11-11 | 2025-11-10 | $228.68 (2024-11-26) | $186.48 (2025-08-01) |
|
The current price is $226.11, which is above the 0.786 Fibonacci level, indicating the stock is potentially in an extended move beyond typical retracement levels. This suggests strong bullish sentiment with potential support around the 0.786 level.
Conclusion
Assurant, Inc.'s stock has shown a formidable uptrend, reflecting strong investor confidence. The breach of the 0.786 Fibonacci level highlights bullish momentum, although investors should remain cautious of potential market corrections. The company's comprehensive product offerings in lifestyle and housing continue to position it well for growth across diverse markets. Analysts should consider the potential for a reversal if support at key Fibonacci levels falter. Continuous monitoring of market dynamics and strategic fiscal management will be crucial for optimizing investment returns.
Smart Data Insight
Master the Perfect Entry & Exit for this Stock
Don't leave your profits to chance. Historically, this stock follows specific seasonal patterns that institutional traders use to maximize returns.
- ✅ Identify the "Golden Buying Window"
- ✅ Avoid high-risk correction cycles
- ✅ Backtested data from the last 20+ years