March 09, 2026 a 12:46 pm


AIZ: Dividend Analysis - Assurant, Inc.
Assurant, Inc. is a prominent player in the insurance industry with a firm commitment to rewarding its shareholders through regular dividend payments. With a steady history of dividends spread over 23 years, the reliance on dividends as a key element of shareholder value is pronounced. Unsurprisingly, the current dividend yield is 1.52%, which is competitive within its sector. This consistency indicates a stable financial footing, though the relatively modest dividend yield implies a focus on sustainable growth.
📊 Overview
Assurant, Inc. operates predominantly in the insurance sector, noted for its stability and steady cash flow generation capabilities. Below is a concise snapshot of its dividend-related metrics:
| Metric | Value |
|---|---|
| Sector | Insurance |
| Dividend Yield | 1.52% |
| Current Dividend per Share | 3.33 USD |
| Dividend History | 23 years |
| Last Cut or Suspension | None |
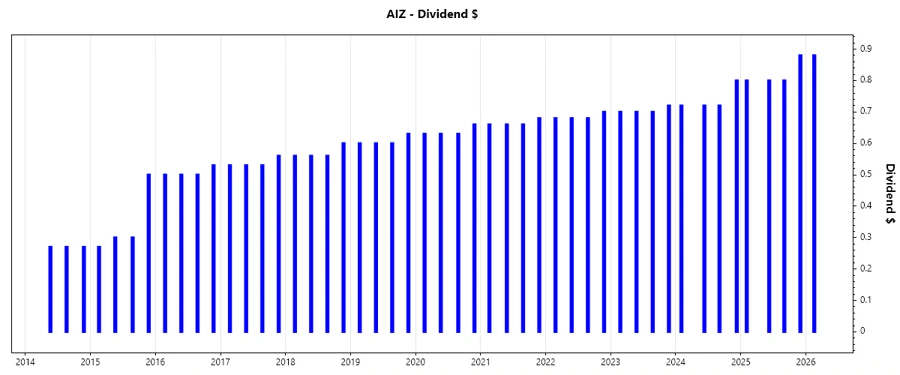
🗣️ Dividend History
The dividend history is a crucial indicator of a company's commitment to rewarding its investors. A reliable dividend history enhances investor confidence, particularly in volatile markets. Assurant, Inc.'s extensive 23-year track record showcases a solid commitment to providing consistent payouts to shareholders.
| Year | Dividend per Share (USD) |
|---|---|
| 2026 | 0.88 |
| 2025 | 3.28 |
| 2024 | 2.96 |
| 2023 | 2.82 |
| 2022 | 2.74 |
📈 Dividend Growth
Dividend growth reflects a company's capacity to sustain or augment its dividend payouts, signaling robust financial health and management's confidence in future earnings. Examining growth rates provides insight into this aspect of a firm's long-term policy:
| Time | Growth |
|---|---|
| 3 years | 6.18% |
| 5 years | 5.16% |
The average dividend growth is 5.16% over 5 years. This shows moderate but steady dividend growth, aligning with the company's strategy to maintain shareholder value while ensuring sustainability.
📉 Payout Ratio
Payout ratios offer key insights into how much profit a company returns to shareholders in the form of dividends. A balanced payout ratio indicates prudent financial governance, balancing between reinvestment and rewarding shareholders:
| Key Figure | Ratio |
|---|---|
| EPS-based | 19.19% |
| Free cash flow-based | 10.45% |
With an EPS-based payout ratio of 19.19% and an FCF-based ratio of 10.45%, Assurant, Inc. maintains a conservative payout policy, reflecting room for both growth opportunities and potential dividend hikes.
✅ Cashflow & Capital Efficiency
Effective cash flow management stands as a pillar of an organization's fiscal strength, ensuring the stable fulfillment of obligations and opportunities for expansion. Here's how Assurant, Inc. scores on various cash flow metrics:
| Metric | 2025 | 2024 | 2023 |
|---|---|---|---|
| Free Cash Flow Yield | 13.15% | 9.97% | 10.39% |
| Earnings Yield | 7.18% | 6.83% | 7.13% |
| CAPEX to Operating Cash Flow | 12.84% | 16.61% | 17.79% |
| Stock-based Compensation to Revenue | 0% | 0.68% | 0.67% |
| Free Cash Flow / Operating Cash Flow Ratio | 87.16% | 83.39% | 82.21% |
The cash flow analysis underscores disciplined capital management, with solid free cash flow yields and efficient operating cash flow, showcasing resilience and capability to sustain and grow dividends.
⚠️ Balance Sheet & Leverage Analysis
Understanding leverage and balance sheet metrics is crucial for assessing the financial health and risk profile of a company. Here's a detailed look:
| Metric | 2025 | 2024 | 2023 |
|---|---|---|---|
| Debt-to-Equity | 0.38 | 0.41 | 0.43 |
| Debt-to-Assets | 0.06 | 0.06 | 0.06 |
| Debt-to-Capital | 0.27 | 0.29 | 0.30 |
| Net Debt to EBITDA | 0.26 | 0.22 | 0.41 |
| Current Ratio | 0.50 | 0.00 | 0.00 |
| Quick Ratio | 0.50 | 0.00 | 0.00 |
| Financial Leverage | 6.18 | 6.86 | 6.99 |
While leverage is manageable, the company's strategic use of financial leverage indicates efficacy in balancing growth with financial stability, though attention to increasing financial leverage and current ratios is warranted.
⚖️ Fundamental Strength & Profitability
Fundamental ratios such as profitability and return metrics provide a window into operational efficiency and competitive positioning:
| Metric | 2025 | 2024 | 2023 |
|---|---|---|---|
| Return on Equity | 14.86% | 14.89% | 13.36% |
| Return on Assets | 2.40% | 2.17% | 1.91% |
| Net Profit Margin | 6.81% | 6.40% | 5.77% |
| EBIT Margin | 9.34% | 8.71% | 8.22% |
| Gross Profit Margin | 77.15% | 76.71% | 77.35% |
| R&D to Revenue | 0% | 0% | 0% |
Assurant, Inc. demonstrates respectable return on equity and profitability margins indicative of a viable business model, though limited R&D investments suggest a focus on optimizing existing operations.
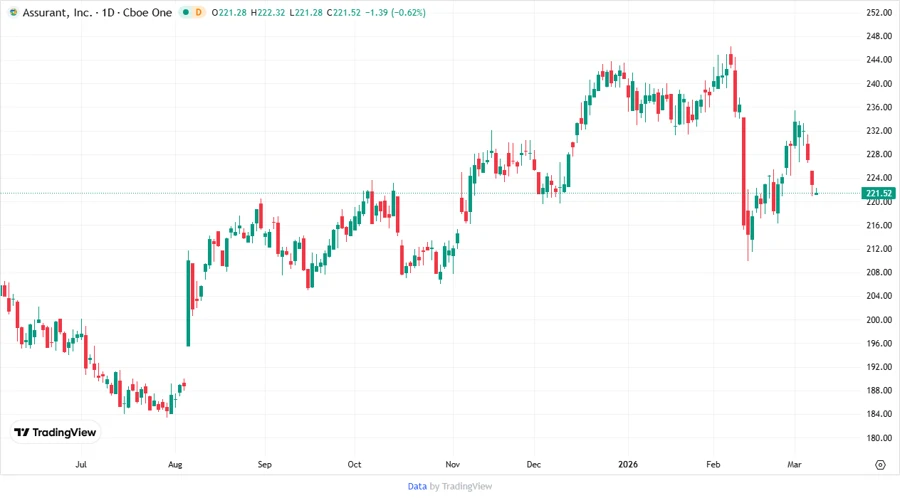
🏷️ Price Development
📌 Dividend Scoring System
| Criteria | Description | Score |
|---|---|---|
| Dividend Yield | Modest but consistent | 2/5 |
| Dividend Stability | Reliable history | 4/5 |
| Dividend Growth | Steady over time | 3/5 |
| Payout Ratio | Prudent management | 4/5 |
| Financial Stability | Solid leverage management | 3/5 |
| Dividend Continuity | No cuts or suspensions | 5/5 |
| Cashflow Coverage | Strong FCF management | 4/5 |
| Balance Sheet Quality | Sufficient coverage | 3/5 |
Total Score: 28/40
⭐ Rating
Assurant, Inc. exhibits a compelling dividend profile with consistent yields and a dependable history. Its balance between dividend payments and internal investments affirms its strategic vigour. While offering a moderate yield, the company's focus on sustainable growth and efficient cash flow utilization underscores its potential for long-term value generation. This analysis positions Assurant, Inc. as a recommended holding for income-focused investors seeking stable yet resilient opportunities within the insurance sector.
Smart Data Insight
Master the Perfect Entry & Exit for this Stock
Don't leave your profits to chance. Historically, this stock follows specific seasonal patterns that institutional traders use to maximize returns.
- ✅ Identify the "Golden Buying Window"
- ✅ Avoid high-risk correction cycles
- ✅ Backtested data from the last 20+ years