December 04, 2025 a 11:31 am

AIZ: Dividend Analysis - Assurant, Inc.
Assurant, Inc., with its consistent dividend history of 22 years, demonstrates resilience and commitment to returning value to shareholders. The relatively low payout ratios suggest room for future dividend growth, although the current yield may not immediately attract income-focused investors. Overall, Assurant presents a stable dividend profile with potential for growth in tumultuous markets.
📊 Overview
| Detail | Data |
|---|---|
| Sector | Financials |
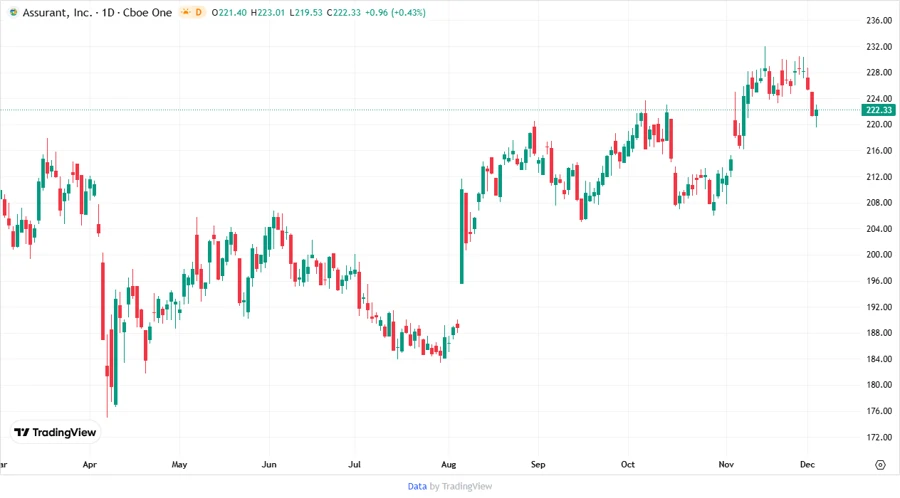
| Dividend yield | 1.45% |
| Current dividend per share | 2.98 USD |
| Dividend history | 22 years |
| Last cut or suspension | None |
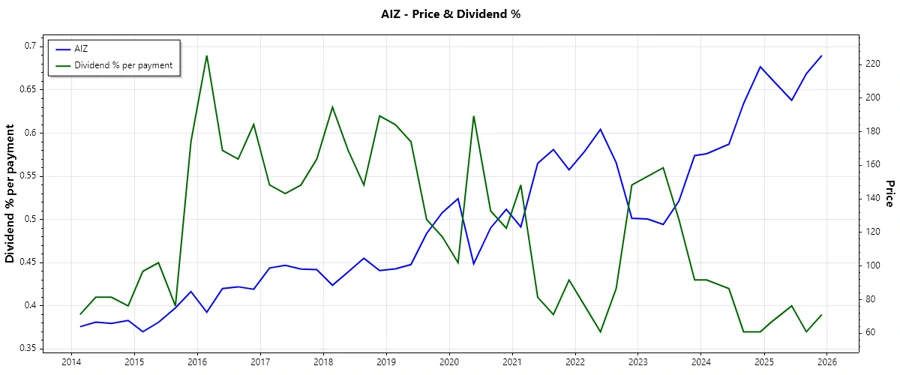
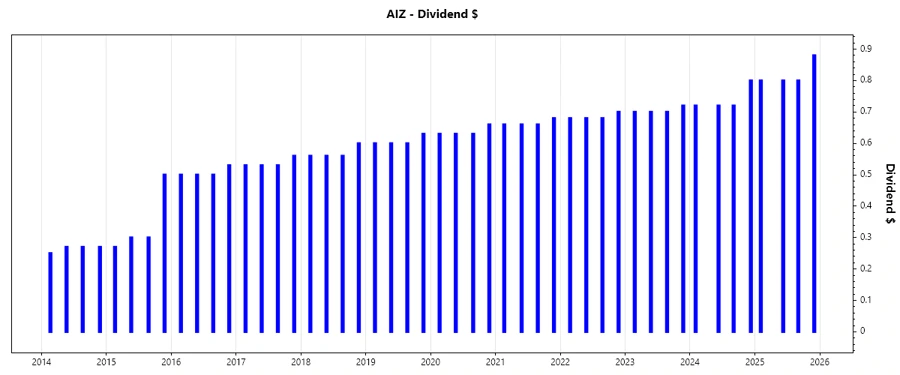
📈 Dividend History
The consistent track of dividend payments over the last two decades highlights Assurant's dedication to rewarding its shareholders. Maintaining such a record through economic fluctuations is notable, giving investors confidence in the company's stability.
| Year | Dividend per Share (USD) |
|---|---|
| 2025 | 3.28 |
| 2024 | 2.96 |
| 2023 | 2.82 |
| 2022 | 2.74 |
| 2021 | 2.66 |
📉 Dividend Growth
Analyzing the growth rate offers insights into future potential returns. While the growth appears modest, the steady increase underscores a sustainable approach to enhancing shareholder value, which is crucial for long-term investors.
| Time | Growth |
|---|---|
| 3 years | 3.63% |
| 5 years | 4.02% |
The average dividend growth is 4.02% over 5 years. This shows moderate but steady dividend growth.
🗣️ Payout Ratio
Payout ratios are critical in determining if dividends are sustainable. Assurant exhibits EPS and FCF-based payout ratios of 17.87% and 14.63% respectively, indicating a comfortable margin for maintaining and potentially increasing dividends.
| Key Figure | Ratio |
|---|---|
| EPS-based | 17.87% |
| Free cash flow-based | 14.63% |
Given these healthy ratios, Assurant's dividends appear sustainable, with ample room for future growth.
🔍 Cashflow & Capital Efficiency
Assessing cash flow and capital efficiency helps in understanding the financial robustness of a company. Key indicators like Free Cash Flow Yield and CAPEX to Operating Cash Flow present insights into how well Assurant converts investment into operational revenues.
| Year | 2024 | 2023 | 2022 |
|---|---|---|---|
| Free Cash Flow Yield | 9.98% | 10.39% | 6.04% |
| Earnings Yield | 6.83% | 7.13% | 4.07% |
| CAPEX to Operating Cash Flow | 16.61% | 17.79% | 31.21% |
| Stock-based Compensation to Revenue | 0.68% | 0.67% | 0.61% |
| Free Cash Flow / Operating Cash Flow Ratio | 83.39% | 82.21% | 68.79% |
The overall cash flow yields and efficient use of capital indicate strong potential for sustained profitability and financial health.
📈 Balance Sheet & Leverage Analysis
Balance sheet analysis gives comprehensive insights into a company's leverage and ability to weather fiscal challenges. Assurant's debt metrics showcase controlled leverage, supporting its long-term financial strategy.
| Year | 2024 | 2023 | 2022 |
|---|---|---|---|
| Debt-to-Equity | 40.79% | 43.26% | 50.37% |
| Debt-to-Assets | 5.95% | 6.18% | 6.43% |
| Debt-to-Capital | 28.97% | 30.19% | 33.50% |
| Net Debt to EBITDA | 0.22 | 0.41 | 0.93 |
| Current Ratio | 2.61 | 19.91 | 2.41 |
| Quick Ratio | 2.61 | 19.91 | 2.41 |
| Financial Leverage | 6.86 | 6.99 | 7.83 |
The moderate leverage and solid liquidity ratios underscore Assurant's prudent financial management and resilience in cyclical downturns.
🔎 Fundamental Strength & Profitability
Analyzing fundamental performance metrics reflects the intrinsic profitability and operational effectiveness of a company. Assurant's return ratios and margins emphasize its ability to generate profit efficiently.
| Year | 2024 | 2023 | 2022 |
|---|---|---|---|
| Return on Equity | 14.89% | 13.36% | 6.54% |
| Return on Assets | 2.17% | 1.91% | 0.84% |
| Net Margin | 6.40% | 5.77% | 2.71% |
| EBIT Margin | 8.71% | 8.22% | 4.50% |
| EBITDA Margin | 10.59% | 9.98% | 6.28% |
| Gross Margin | 76.71% | 77.35% | 76.85% |
| R&D to Revenue | 0% | 0% | 0% |
The robust return figures and sustained margins illustrate Assurant's strategic strength in maintaining competitiveness and profitability.
✅ Dividend Scoring System
| Category | Score | Score Bar |
|---|---|---|
| Dividend yield | 3 | |
| Dividend Stability | 5 | |
| Dividend growth | 4 | |
| Payout ratio | 4 | |
| Financial stability | 5 | |
| Dividend continuity | 5 | |
| Cashflow Coverage | 4 | |
| Balance Sheet Quality | 4 |
Total Score: 34/40
🏆 Rating
Assurant, Inc. provides a compelling case for investment with a well-rounded dividend profile, backed by financial stability and consistent dividend payments. Investors seeking steady growth should find confidence in its moderate yield and robust payout ratios, making it a resilient choice in a diversified portfolio.