August 07, 2025 a 12:46 pm


AIZ: Dividend Analysis - Assurant, Inc.
Assurant, Inc. presents a moderate dividend profile with a yield of 1.57%. The company's consistent dividend history spanning over 22 years highlights its commitment to shareholder returns. Though recent growth has been slow, Assurant’s strategic financial management ensures dividend stability.
📊 Overview
The following table provides key insights into Assurant's dividend profile, showcasing sector placement and important financial metrics.
| Metric | Details |
|---|---|
| Sector | Financial Services |
| Dividend yield | 1.57 % |
| Current dividend per share | 2.98 USD |
| Dividend history | 22 years |
| Last cut or suspension | None |
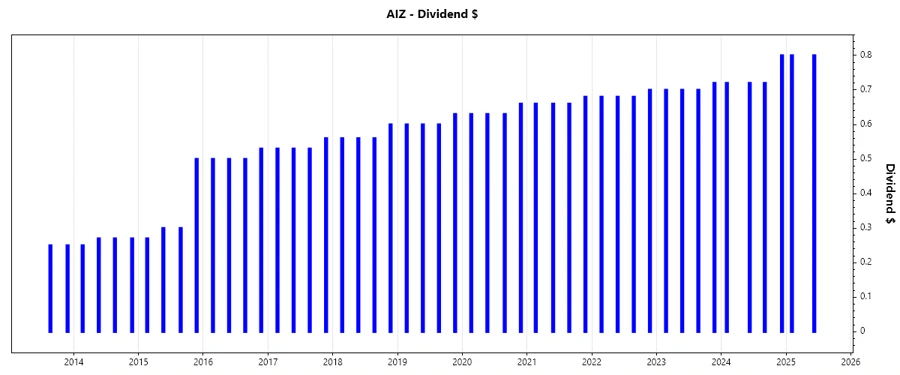
📈 Dividend History
Assurant’s strong dividend history reflects its resilience and dedication to returning profits to shareholders. Maintaining uninterrupted payments over 22 years emphasizes its strategic management in varying economic climates.
| Year | Dividend per Share (USD) |
|---|---|
| 2025 | 1.60 |
| 2024 | 2.96 |
| 2023 | 2.82 |
| 2022 | 2.74 |
| 2021 | 2.66 |
📈 Dividend Growth
A crucial factor for investors, dividend growth, indicates the company’s ability to enhance payout levels over time. Assurant's growth rates suggest a cautious yet consistent enhancement in shareholder value.
| Time | Growth |
|---|---|
| 3 years | 3.63 % |
| 5 years | 4.02 % |
The average dividend growth is 4.02 % over 5 years. This shows moderate but steady dividend growth.
📊 Payout Ratio
Payout ratios are integral for evaluating dividend sustainability. A lower payout ratio typically signifies safety, with earnings adequately supporting future dividends.
| Key figure | Ratio |
|---|---|
| EPS-based | 22.83 % |
| Free cash flow-based | 9.63 % |
The EPS payout ratio of 22.83 % and FCF payout of 9.63 % reflect Assurant's conservative and sustainable dividend policy, indicating robust future payouts.
📊 Cashflow & Capital Efficiency
Assessing cash flow and capital efficiency provides insight into operating strengths and investment outcomes. High free cash flow, alongside balanced expenditures, enhances operational resilience.
| 2024 | 2023 | 2022 |
|---|---|---|
| Free Cash Flow Yield: 9.98% | Free Cash Flow Yield: 10.39% | Free Cash Flow Yield: 6.04% |
| Earnings Yield: 6.83% | Earnings Yield: 7.13% | Earnings Yield: 4.07% |
| CAPEX/OCF: 16.61% | CAPEX/OCF: 17.79% | CAPEX/OCF: 31.21% |
| Stock Compensation/Revenue: 0.68% | Stock Compensation/Revenue: 0.67% | Stock Compensation/Revenue: 0.61% |
| FCF/OCF Ratio: 83.39% | FCF/OCF Ratio: 82.21% | FCF/OCF Ratio: 68.79% |
Positive cash flow trends and effective capital deployment underscore Assurant's operational success and prudent capital management strategy.
📊 Balance Sheet & Leverage Analysis
A strong balance sheet is foundational to financial health, safeguarding against volatility. Assurant maintains a balanced debt profile, enhancing financial tolerance.
| 2024 | 2023 | 2022 |
|---|---|---|
| Debt/Equity: 40.79% | Debt/Equity: 43.26% | Debt/Equity: 50.37% |
| Debt/Assets: 5.95% | Debt/Assets: 6.19% | Debt/Assets: 6.43% |
| Debt/Capital: 28.97% | Debt/Capital: 30.19% | Debt/Capital: 33.50% |
| Net Debt/EBITDA: 0.22 | Net Debt/EBITDA: 0.40 | Net Debt/EBITDA: 0.93 |
| Current Ratio: 5.71 | Current Ratio: 19.91 | Current Ratio: 2.41 |
| Quick Ratio: 5.71 | Quick Ratio: 19.91 | Quick Ratio: 2.45 |
| Financial Leverage: 6.86 | Financial Leverage: 6.99 | Financial Leverage: 7.83 |
Assurant's managed leverage metrics and liquidity measures denote a stable financial standing, supporting ongoing operations and strategic initiatives.
📊 Fundamental Strength & Profitability
The ability to generate profit accurately marks a company's competitive advantage, aided by operational margins and efficient capital utilization.
| 2024 | 2023 | 2022 |
|---|---|---|
| ROE: 14.89% | ROE: 13.36% | ROE: 6.54% |
| ROA: 2.17% | ROA: 1.91% | ROA: 0.84% |
| Net Margin: 6.40% | Net Margin: 5.77% | Net Margin: 2.71% |
| EBIT Margin: 8.71% | EBIT Margin: 8.22% | EBIT Margin: 4.50% |
| EBITDA Margin: 10.59% | EBITDA Margin: 10.08% | EBITDA Margin: 6.27% |
| Gross Margin: 76.71% | Gross Margin: 77.35% | Gross Margin: 100.00% |
| R&D to Revenue: 0% | R&D to Revenue: 0% | R&D to Revenue: 0% |
The progressive improvement in profitability and margin indicators demonstrate Assurant’s efficiency in harnessing growth opportunities.
📉 Price Development
✅ Dividend Scoring System
| Criterion | Score | Progress |
|---|---|---|
| Dividend yield | 3 | |
| Dividend Stability | 5 | |
| Dividend growth | 3 | |
| Payout ratio | 5 | |
| Financial stability | 4 | |
| Dividend continuity | 5 | |
| Cashflow Coverage | 4 | |
| Balance Sheet Quality | 3 |
Total Score: 32/40
🗣️ Rating
Assurant, Inc. is rated favorably with consistent dividends and robust financial fundamentals. Investors considering long-term holdings can benefit from its sustained market presence and strategic financial stability, making it a solid choice in diversified portfolios.
Smart Data Insight
Master the Perfect Entry & Exit for this Stock
Don't leave your profits to chance. Historically, this stock follows specific seasonal patterns that institutional traders use to maximize returns.
- ✅ Identify the "Golden Buying Window"
- ✅ Avoid high-risk correction cycles
- ✅ Backtested data from the last 20+ years