November 21, 2025 a 09:03 am

AIG: Trend and Support & Resistance Analysis - American International Group, Inc.
American International Group, Inc. (AIG) provides a wide array of insurance products across the globe, catering to both individuals and commercial entities. Since its inception in 1919, the company has established itself as a prominent player in the financial services sector with a diverse portfolio comprising general insurance, life insurance, and retirement services. Despite current market volatilities, AIG's strong fundamentals and innovative offerings may provide stability, though investors should be wary of economic downturns which could impact valuation.
Trend Analysis
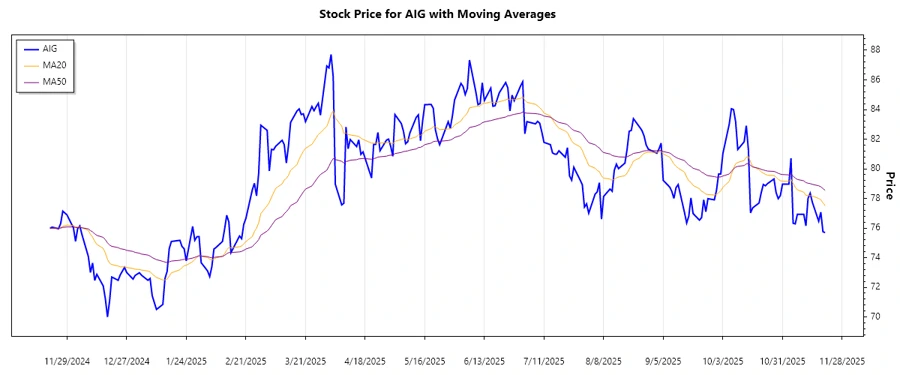
After a thorough examination of the recent price data, it is observed that the AIG stock is exhibiting mixed signals. Calculating the EMA for the past 20 and 50 days reveals crucial insights:
| Date | Close Price | Trend |
|---|---|---|
| 2025-11-20 | 75.69 | ▼ |
| 2025-11-19 | 75.75 | ▼ |
| 2025-11-18 | 77.07 | ▲ |
| 2025-11-17 | 76.46 | ▼ |
| 2025-11-14 | 77.75 | ▲ |
| 2025-11-13 | 78.35 | ▲ |
| 2025-11-12 | 78.00 | ⚖️ |
The recent trend indicates more presence of a bearish signal as the EMA20 is consistently falling below EMA50.
Support and Resistance
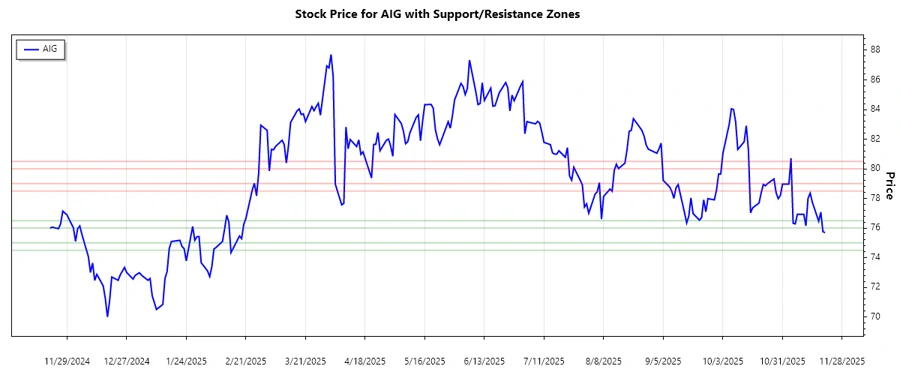
Based on the analysis of past price movements, we identify that the stock has relevant support and resistance levels:
| Type | Zone From | Zone To |
|---|---|---|
| Support | 74.50 | 75.00 |
| Support | 76.00 | 76.50 |
| Resistance | 78.50 | 79.00 |
| Resistance | 80.00 | 80.50 |
The current price is close to a potential support zone, suggesting a possible rebound in the near term.
Conclusion
The technical analysis of AIG suggests caution for investors as the overall trend presents as bearish, with the EMA20 often positioned below the EMA50. The presence of close-by support zones hints at possible resistance against falling prices. Investors are advised to monitor global market conditions, as external economic factors could heavily influence AIG's price, especially given the company's exposure to multiple insurance sectors.
Smart Data Insight
Master the Perfect Entry & Exit for this Stock
Don't leave your profits to chance. Historically, this stock follows specific seasonal patterns that institutional traders use to maximize returns.
- ✅ Identify the "Golden Buying Window"
- ✅ Avoid high-risk correction cycles
- ✅ Backtested data from the last 20+ years