September 21, 2025 a 04:03 am
AIG: Trend and Support & Resistance Analysis - American International Group, Inc.
American International Group, Inc. has shown a mixed performance over the past months with fluctuating prices impacted by market dynamics. The company, a major player in insurance, has experienced phases of growth and decline, driven by external economic factors and internal strategies. As of now, the trend shows signs of weakening momentum, which might concern investors focusing on short-term gains.
Trend Analysis
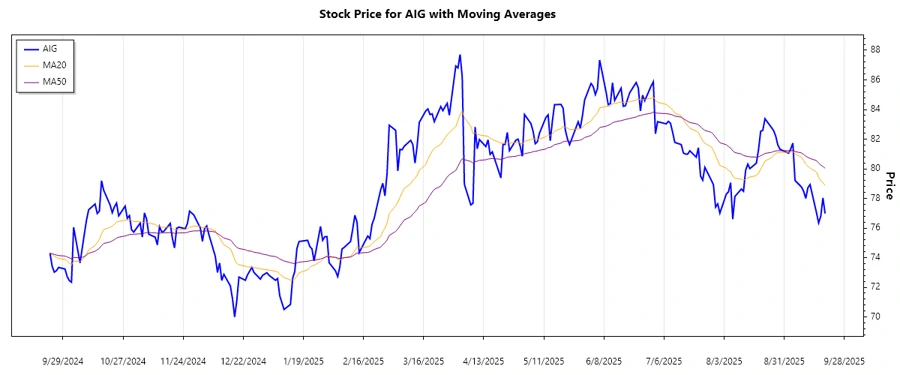
The analysis of AIG's closing prices over the past months reveals a pattern of volatility. Calculating the Exponential Moving Averages (EMA), the EMA20 is currently lower than the EMA50, indicating a ▼ Abwärtstrend. This suggests that bearish sentiments are prevailing in the market for AIG.
| Date | Closing Price | Trend |
|---|---|---|
| 2025-09-19 | 76.98 | ▼ |
| 2025-09-18 | 78.03 | ▲ |
| 2025-09-17 | 76.8 | ▼ |
| 2025-09-16 | 76.34 | ▼ |
| 2025-09-15 | 77.03 | ▲ |
| 2025-09-12 | 78.93 | ▲ |
| 2025-09-11 | 78.72 | ▲ |
With the current bearish trend, investors might exercise caution in their trading strategies concerning AIG, particularly focusing on confirmatory data for potential trend reversals.
Support- and Resistance
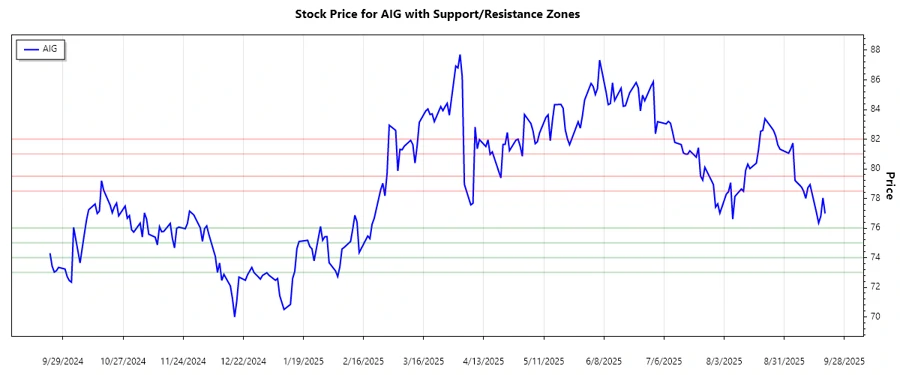
Analyzing historical price data for AIG has identified the following key support and resistance zones. These levels provide critical insights into potential future price movements, guiding traders in their decision-making processes.
| Zone Type | From | To |
|---|---|---|
| Resistance Zone 1 | 78.5 | 79.5 |
| Resistance Zone 2 | 81.0 | 82.0 |
| Support Zone 1 | 75.0 | 76.0 |
| Support Zone 2 | 73.0 | 74.0 |
Currently, AIG's price resides within the Support Zone 1, which could provide a buffer against further declines if demand picks up in this range.
Conclusion
AIG is currently in a bearish trend with significant support at the 75-76 pricing range, offering potential protection against further declines. Investors should watch for volume trends and broader market indicators to gauge if a reversal is forthcoming. The company's strategic moves and market performance continue to pose both risks and opportunities. Short-term traders may capitalize on price fluctuations within these zones, while long-term investors may focus on the company's fundamentals and strategic developments.
Analysis Summary
This analysis identifies the current trend as downward, with opportunities to leverage support at lower price levels. Caution should be applied, especially in light of economic uncertainties influencing overall market sentiment.
Smart Data Insight
Master the Perfect Entry & Exit for this Stock
Don't leave your profits to chance. Historically, this stock follows specific seasonal patterns that institutional traders use to maximize returns.
- ✅ Identify the "Golden Buying Window"
- ✅ Avoid high-risk correction cycles
- ✅ Backtested data from the last 20+ years