May 16, 2026 a 10:15 am
AIG: Fibonacci Analysis - American International Group, Inc.
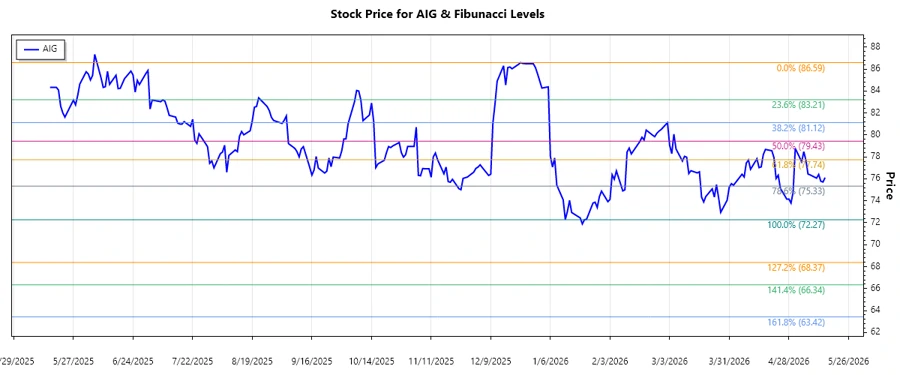
The American International Group (AIG) stock has been experiencing a downward trend over the last months. Despite some fluctuations, the price has seen a consistent decline since December 2025. Investors should consider the potential for a reversal or further decline, particularly with economic factors impacting the financial sector globally. Careful consideration of support levels and potential market sentiment shifts is crucial for trading decisions.
Fibonacci Analysis
| Trend Start Date | Trend End Date | High Price (Date) | Low Price (Date) |
|---|---|---|---|
| 2025-12-23 | 2026-05-15 | 86.59 (2025-12-23) | 72.27 (2026-01-22) |
Fibonacci Retracement Levels
| Level | Price |
|---|---|
| 0.236 | 75.97 |
| 0.382 | 78.01 |
| 0.5 | 79.43 |
| 0.618 | 80.85 |
| 0.786 | 82.96 |
The current price of 76.11 is in the 0.236 Fibonacci retracement zone, indicating a minor halt in the downtrend. This could serve as a short-term support level.
Conclusion
The recent analysis of AIG's stock indicates a notable downtrend from December 2025 to May 2026. Although the price recently found some support at the 0.236 Fibonacci retracement level, continuous vigilance is necessary to ascertain if the current level maintains support or if a potential reversal is on the horizon. Challenges within the insurance sector, coupled with broader economic conditions, could either hinder recovery or promote volatility. Analysts should watch for confirmed technical signals before making significant market moves.
Smart Data Insight
Master the Perfect Entry & Exit for this Stock
Don't leave your profits to chance. Historically, this stock follows specific seasonal patterns that institutional traders use to maximize returns.
- ✅ Identify the "Golden Buying Window"
- ✅ Avoid high-risk correction cycles
- ✅ Backtested data from the last 20+ years