October 25, 2025 a 10:15 am
AIG: Fibonacci Analysis - American International Group, Inc.
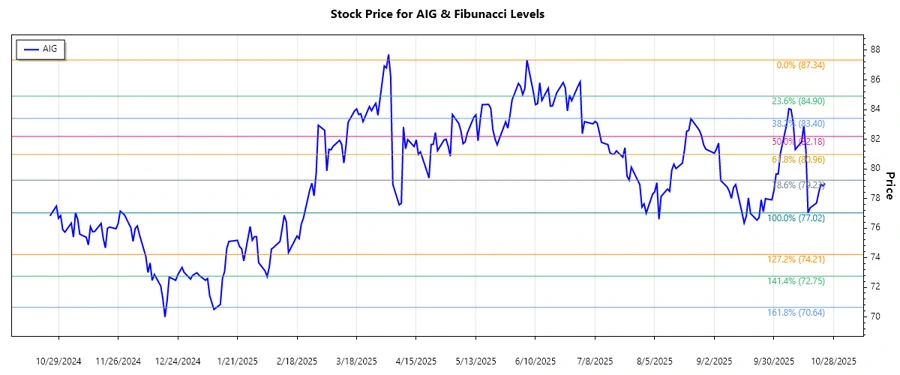
American International Group, Inc. (AIG) has been showcasing a predominant downward trend from mid-June to late October 2025. This analysis uses the recent downward momentum to examine potential support and resistance levels through Fibonacci retracement. The company's diversification in various insurance products provides a strong foundation, but the recent stock performance might reflect broader market challenges or internal considerations impacting investor sentiment.
Fibonacci Analysis
| Trend Analysis Details | Information |
|---|---|
| Start Date | 2025-06-06 |
| End Date | 2025-10-24 |
| High Point | 87.34 on 2025-06-06 |
| Low Point | 77.02 on 2025-10-16 |
| Fibonacci Level | Price Level |
|---|---|
| 23.6% | 79.68 |
| 38.2% | 81.05 |
| 50% | 82.18 |
| 61.8% | 83.30 |
| 78.6% | 84.70 |
The current price of $79 suggests that AIG's stock is hovering near the 23.6% Fibonacci retracement level, indicating that it is currently poised in the initial retracement zone. This could potentially act as an immediate support, and any breach may drive the price down further.
Conclusion
AIG's stock performance continues to delineate a descending pattern, suggesting caution for short-term investors. The proximity to the 23.6% Fibonacci level suggests potential for minor rebounds, offering both risk and opportunity. The Fibonacci levels highlighted offer prospective floor and ceiling price points, aiding in strategic investment decisions. Long-term holders may experience volatility amidst rising uncertainty, while technical investors may find short-term opportunities in retracement bounces.
Smart Data Insight
Master the Perfect Entry & Exit for this Stock
Don't leave your profits to chance. Historically, this stock follows specific seasonal patterns that institutional traders use to maximize returns.
- ✅ Identify the "Golden Buying Window"
- ✅ Avoid high-risk correction cycles
- ✅ Backtested data from the last 20+ years