
July 21, 2026 a 07:31 am
AIG: Dividend Analysis - American International Group, Inc.
American International Group, Inc. (AIG) showcases a robust dividend profile with a commendable dividend yield and a rich history of consistent payouts extending over four decades. The firm's balanced approach to dividend distributions reflects its long-term commitment to shareholder returns, though recent growth rates suggest a moderate pace. While potential investors should be cognizant of the firm’s payout ratios indicating a sustainable trajectory, its financial stability is a reassuring factor. As such, AIG remains an attractive prospect for dividend-focused investors keen on steady income with a balance of growth and reliability.
Overview 📊
AIG operates within the financial sector, boasting a dividend yield of 2.47% with a current dividend per share of $1.73. With a proud 40-year history of dividend payouts and no recent cuts or suspensions, AIG stands as a pillar of reliability in income investing.
| Metric | Details |
|---|---|
| Sector | Financial |
| Dividend yield | 2.47% |
| Current dividend per share | $1.73 |
| Dividend history | 40 years |
| Last cut or suspension | None |
Dividend History 📉
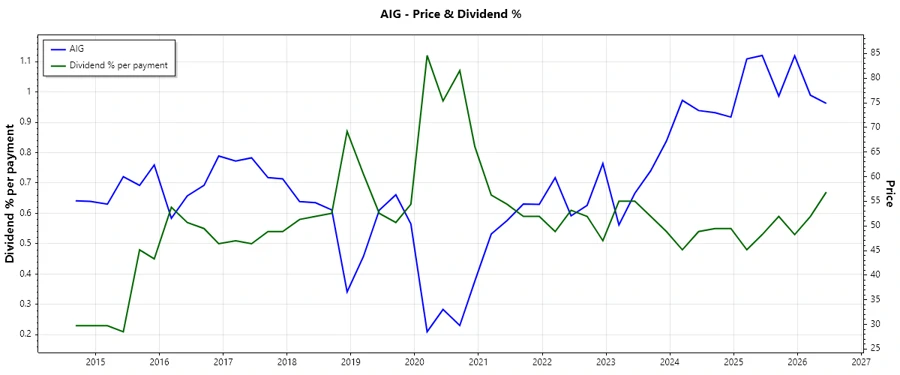
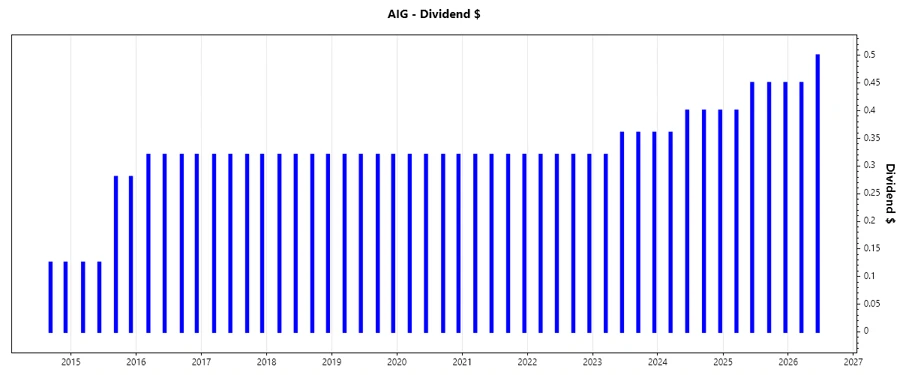
AIG's long-standing dividend history highlights its reliability in generating shareholder value over an extended period. The consistency in payments reflects the firm’s robust cash flows and commitment to returning capital to investors. Recent history shows a slight decline in per-share dividends which deserves attention, especially for income-focused portfolios. Below is a chart illustrating the trend of recent dividends:
| Year | Dividend per Share (USD) |
|---|---|
| 2026 | 0.95 |
| 2025 | 1.75 |
| 2024 | 1.56 |
| 2023 | 1.40 |
| 2022 | 1.28 |
Dividend Growth 📈
Understanding dividend growth is crucial in evaluating a firm's potential for increasing shareholder value. Over the past three years, AIG's dividend growth stands at approximately 10.99%, while the five-year growth rate is 6.45%. Though this indicates a moderate expansion, it reflects a stable financial strategy directing towards sustainable growth.
| Time | Growth |
|---|---|
| 3 years | 10.99% |
| 5 years | 6.45% |
The average dividend growth is 6.45% over 5 years. This shows moderate but steady dividend growth.
Payout Ratio ✅
Payout ratios offer insight into how comfortably a company can cover dividend payments. AIG's EPS-based payout ratio stands at 29.40%, and its free cash flow payout ratio is 25.98%. These figures suggest a conservative, yet shareholder-friendly approach, ensuring dividends are well-covered by earnings and cash flows.
| Key figure | Ratio |
|---|---|
| EPS-based | 29.40% |
| Free cash flow-based | 25.98% |
These payout ratios suggest that AIG maintains a prudent balance between rewarding shareholders with dividends and sustaining growth through reinvestment.
Cashflow & Capital Efficiency 💰
AIG demonstrates proficient management in capital efficiency with a strong free cash flow yield of 8.33% and an earnings yield of 7.36%. Such metrics indicate the company’s ability to generate healthy cash flows relative to its operational scale. The zero CAPEX to Operating Cash Flow ratio reiterates nominal capital expenditure, possibly suggesting mature operations.
| Year | Free Cash Flow Yield | Earnings Yield | CAPEX to Operating Cash Flow | Stock-based Compensation to Revenue | Free Cash Flow / Operating Cash Flow Ratio | Return on Invested Capital |
|---|---|---|---|---|---|---|
| 2025 | 6.85% | 6.40% | 0 | 0 | 1 | 5.29% |
| 2024 | 7.42% | -3.18% | 0 | 0 | 1 | 4.47% |
| 2023 | 12.81% | 7.47% | 0 | 0 | 1 | 0.63% |
Consistent positive free cash flow yields and earnings yields indicate strong cash generation capabilities, reinforcing financial resilience.
Balance Sheet & Leverage Analysis 📜
AIG enjoys a healthy balance sheet with a debt-to-equity ratio of 22.34% and a debt-to-assets ratio of 5.70%. Such ratios reflect moderate leverage levels, while a strong current and quick ratio further conveys adequate liquidity management.
| Year | Debt-to-Equity | Debt-to-Assets | Debt-to-Capital | Net Debt to EBITDA | Current Ratio | Quick Ratio | Financial Leverage |
|---|---|---|---|---|---|---|---|
| 2025 | 22.34% | 5.70% | 18.26% | 1.02 | 0.85 | 0.85 | 3.92 |
| 2024 | 20.98% | 5.53% | 17.34% | 0.96 | 1.28 | 1.28 | 3.79 |
| 2023 | 23.94% | 2.01% | 19.31% | 1.29 | 1.26 | 1.26 | 11.89 |
AIG’s leveraged positions are modest and showcase stability, warranting confidence in its continued operational and financial performance.
Fundamental Strength & Profitability 📈
AIG's profitability metrics such as Return on Equity (ROE) and Return on Assets (ROA) project a steady picture of operational efficiency. Though past figures showed volatility, recent improvements indicate strategic emphasis on reinforcing core strengths.
| Year | Return on Equity | Return on Assets | Margins: Net | EBIT | EBITDA | Gross | Research & Development to Revenue |
|---|---|---|---|---|---|---|---|
| 2025 | 7.53% | 1.92% | 11.56% | 15.97% | 28.87% | 34.51% | 0 |
| 2024 | -3.30% | -0.87% | -5.15% | 15.88% | 29.08% | 34.02% | 0 |
| 2023 | 8.03% | 0.68% | 13.03% | 12.10% | 25.84% | 15.63% | 0 |
The gradual strengthening of profitability ratios underlines AIG’s positive trajectory in improving organizational value through effective cost and revenue management.
Price Development 📉
Dividend Scoring System 🗣️
| Criteria | Points | Score |
|---|---|---|
| Dividend yield | 4 | |
| Dividend Stability | 5 | |
| Dividend growth | 3 | |
| Payout ratio | 5 | |
| Financial stability | 4 | |
| Dividend continuity | 5 | |
| Cashflow Coverage | 4 | |
| Balance Sheet Quality | 4 |
Total Score: 34 out of 40
Rating & Recommendation
American International Group, Inc. demonstrates a robust dividend profile with an excellent history of stability and a reasonable growth trajectory. With a cumulative score of 34 out of 40, it stands as a strong contender in the dividend landscape. Therefore, AIG is recommended as a favorable option for investors seeking reliable and consistent dividend income with the potential for moderate growth.
Smart Data Insight
Master the Perfect Entry & Exit for this Stock
Don't leave your profits to chance. Historically, this stock follows specific seasonal patterns that institutional traders use to maximize returns.
- ✅ Identify the "Golden Buying Window"
- ✅ Avoid high-risk correction cycles
- ✅ Backtested data from the last 20+ years