
June 13, 2026 a 11:31 am

AIG: Dividend Analysis - American International Group, Inc.
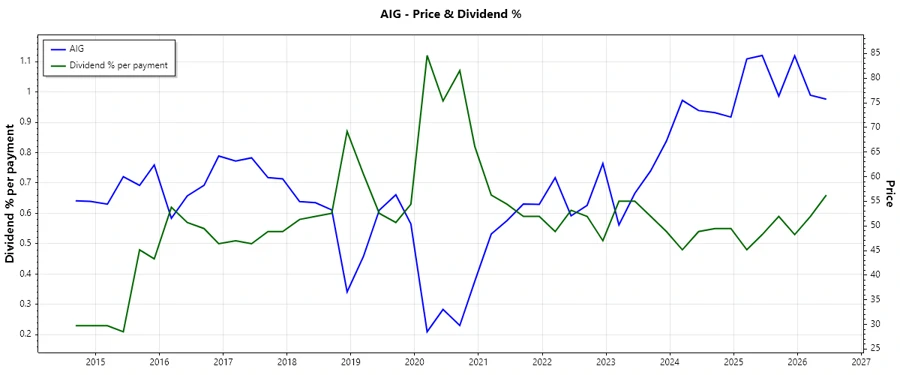
American International Group, Inc. (AIG) showcases a stable dividend payout strategy, highlighted by a current dividend yield of 2.44%. Despite a modest growth rate over the past five years, AIG maintains a solid dividend history over four decades. The conservative payout ratios suggest a sustainable dividend policy, making AIG a potentially reliable dividend stock.
Overview
A comprehensive look at AIG's dividend profile reveals a solid foundation with notable attributes.
| Attribute | Value |
|---|---|
| Sector | Financials |
| Dividend yield | 2.44% |
| Current dividend per share | 1.73 USD |
| Dividend history | 40 years |
| Last cut or suspension | None |
Dividend History
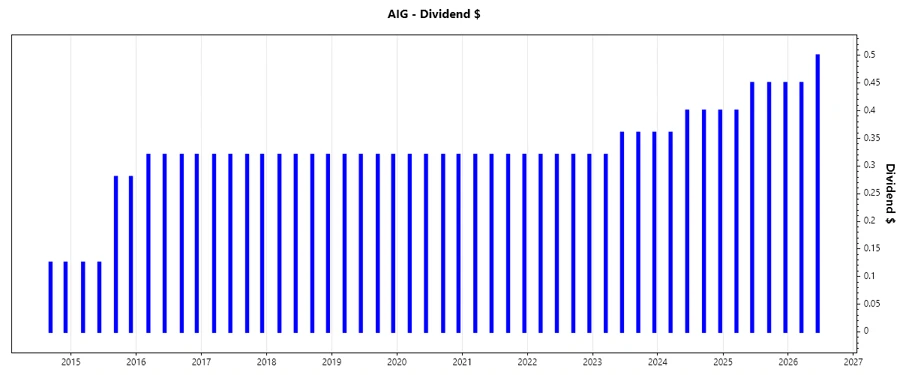
AIG's long dividend payment history accentuates company stability and investor assurance. Consistency over decades is paramount for long-term investment confidence.
| Year | Dividend per Share |
|---|---|
| 2026 | 0.95 USD |
| 2025 | 1.75 USD |
| 2024 | 1.56 USD |
| 2023 | 1.40 USD |
| 2022 | 1.28 USD |
Dividend Growth
Dividend growth indicates a company's profitability and ongoing financial health. Steady increases are a positive signal to investors.
| Time | Growth |
|---|---|
| 3 years | 10.99% |
| 5 years | 6.45% |
The average dividend growth is 6.45% over 5 years. This shows moderate but steady dividend growth.
Payout Ratio
The payout ratio demonstrates what portion of earnings is distributed as dividends, affecting reinvestment potential.
| Key figure | Ratio |
|---|---|
| EPS-based | 29.40% |
| Free cash flow-based | 25.98% |
AIG maintains a healthy payout ratio with 29.40% (EPS) and 25.98% (FCF), indicating room for future dividend increases while still retaining enough for growth and operations.
Cashflow & Capital Efficiency
Cashflow metrics reflect a company's liquidity and ability to fund dividends and capital expenditures. Efficiency ratios highlight effective capital use.
| Description | 2025 | 2024 | 2023 |
|---|---|---|---|
| Free Cash Flow Yield | 6.85% | 7.42% | 12.81% |
| Earnings Yield | 6.40% | -3.18% | 7.47% |
| CAPEX to Operating Cash Flow | 0% | 0% | 0% |
| Stock-based Compensation to Revenue | 0% | 0% | 0% |
| Free Cash Flow / Operating Cash Flow Ratio | 1 | 1 | 1 |
AIG has demonstrated robust cash flow efficiency and capital flexibility, ensuring continued dividend distribution capacity and investment potential.
Balance Sheet & Leverage Analysis
A strong balance sheet with controlled leverage ensures a company's sustainability and operational resilience.
| Metric | 2025 | 2024 | 2023 |
|---|---|---|---|
| Debt-to-Equity | 0.22 | 0.21 | 0.24 |
| Debt-to-Assets | 0.057 | 0.055 | 0.020 |
| Debt-to-Capital | 0.183 | 0.173 | 0.193 |
| Net Debt to EBITDA | 1.02 | 0.96 | 1.29 |
| Current Ratio | 0.85 | 1.28 | 1.26 |
| Quick Ratio | 0.85 | 1.28 | 1.26 |
| Financial Leverage | 3.92 | 3.79 | 11.89 |
AIG's disciplined leverage strategy, evidenced by stable ratios, showcases financial strength and prudent risk management.
Fundamental Strength & Profitability
These metrics highlight AIG's operational efficiency and profitability, essential for long-term growth and shareholder value.
| Metric | 2025 | 2024 | 2023 |
|---|---|---|---|
| Return on Equity | 7.53% | -3.30% | 8.03% |
| Return on Assets | 1.92% | -0.87% | 0.68% |
| Net Margin | 11.56% | -5.15% | 13.03% |
| EBIT Margin | 15.97% | 15.89% | 12.10% |
| EBITDA Margin | 28.87% | 29.08% | 25.84% |
| Gross Margin | 34.51% | 34.02% | 15.63% |
AIG's profitability metrics demonstrate operational competence with respectable returns on equity and assets.
Price Development
Dividend Scoring System
| Criteria | Score | Score Bar |
|---|---|---|
| Dividend yield | 4/5 | |
| Dividend Stability | 5/5 | |
| Dividend growth | 3/5 | |
| Payout ratio | 5/5 | |
| Financial stability | 4/5 | |
| Dividend continuity | 5/5 | |
| Cashflow Coverage | 4/5 | |
| Balance Sheet Quality | 4/5 |
Total Score: 34/40
Rating
American International Group, Inc. secures a strong position in dividend investing with its stable payout history and solid financial metrics. AIG earns a positive recommendation due to its robust dividend policy supported by prudent financial management. It is a dependable choice for dividend-focused portfolios.
Smart Data Insight
Master the Perfect Entry & Exit for this Stock
Don't leave your profits to chance. Historically, this stock follows specific seasonal patterns that institutional traders use to maximize returns.
- ✅ Identify the "Golden Buying Window"
- ✅ Avoid high-risk correction cycles
- ✅ Backtested data from the last 20+ years