October 05, 2025 a 03:15 am
AFL: Trend and Support & Resistance Analysis - Aflac Incorporated
Aflac Incorporated, known for its supplemental health and life insurance products, demonstrates a significant upward trend. Analyzing daily pricing data reveals the company's robust performance, supported by discernibly strong support levels and substantial resistance. The trend indicates bullish market sentiment, favoring long positions. Market participants should be aware of potential resistance challenges that could moderate maintaining the upward momentum.
Trend Analysis
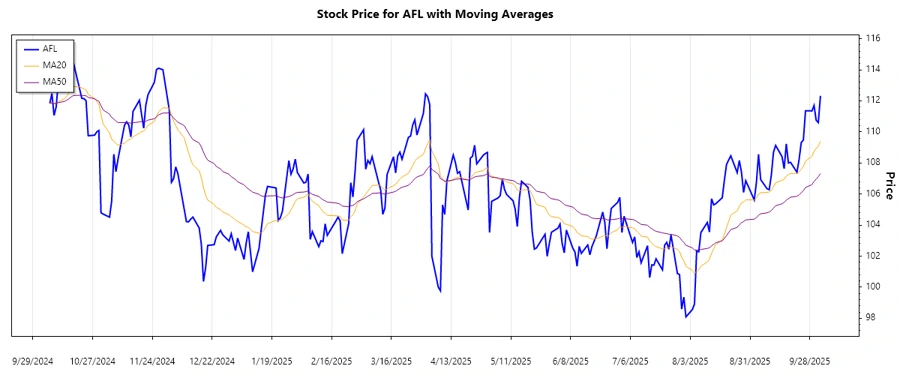
Recent data indicates a persistent ▲ upward trend. The EMA20 surpassed the EMA50, confirming the positive momentum. The technical indicators align with bullish investors' optimism, reflecting increased demand for AFL shares within the analyzed period.
| Date | Close Price | Trend |
|---|---|---|
| 2025-10-03 | 112.32 | ▲ |
| 2025-10-02 | 110.60 | ▲ |
| 2025-10-01 | 110.75 | ▲ |
| 2025-09-30 | 111.70 | ▲ |
| 2025-09-29 | 111.35 | ▲ |
| 2025-09-26 | 111.36 | ▲ |
| 2025-09-25 | 109.48 | ▼ |
Technical analysis confirms a predominantly upward trajectory, reinforcing investor confidence and potential for price appreciation.
Support and Resistance
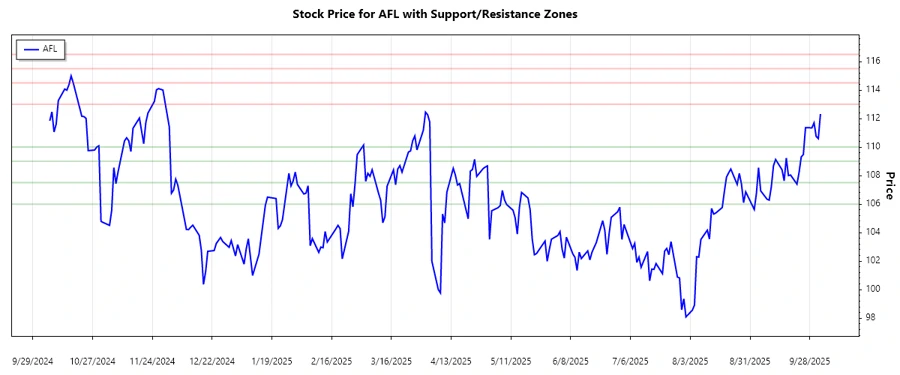
Current analysis highlights significant support levels at $106.00 and $107.50, with resistance zones identified around $113.00 and $114.50.
| Zone Type | From | To |
|---|---|---|
| Support Zone 1 | ▶ | 106.00 |
| Support Zone 2 | ▶ | 107.50 |
| Resistance Zone 1 | 113.00 | ◀ |
| Resistance Zone 2 | 114.50 | ◀ |
The current price trajectory situates AFL within the resistance zone, influencing decision-making in potential breakout scenarios.
Conclusion
Aflac Incorporated presents a bullish outlook, driven by sustained upward price movement and solid support structures. However, investors should note potential resistance levels that could challenge further price increases. These technical insights are vital for making informed investment decisions, balancing potential gains against inherent market risks. The company's expansion and consistent performance fortify a positive long-term view, although vigilance in monitoring market dynamics remains crucial.
Smart Data Insight
Master the Perfect Entry & Exit for this Stock
Don't leave your profits to chance. Historically, this stock follows specific seasonal patterns that institutional traders use to maximize returns.
- ✅ Identify the "Golden Buying Window"
- ✅ Avoid high-risk correction cycles
- ✅ Backtested data from the last 20+ years