August 26, 2025 a 01:16 pm

AFL: Trend and Support & Resistance Analysis - Aflac Incorporated
Aflac Incorporated, primarily operating in the U.S and Japan, offers supplemental health and life insurance. Recently, the stock has been showing fluctuations. With its recent movement in the stock market, analyzing its trends and identifying key support and resistance zones will provide insights into its potential market behavior.
Trend Analysis
| Date | Closing Price | Trend |
|---|---|---|
| 2025-08-25 | $107.38 | ▲ |
| 2025-08-22 | $108.46 | ▲ |
| 2025-08-21 | $108.19 | ▲ |
| 2025-08-20 | $107.90 | ▲ |
| 2025-08-19 | $106.89 | ▼ |
| 2025-08-18 | $105.76 | ▼ |
| 2025-08-15 | $105.38 | ▼ |
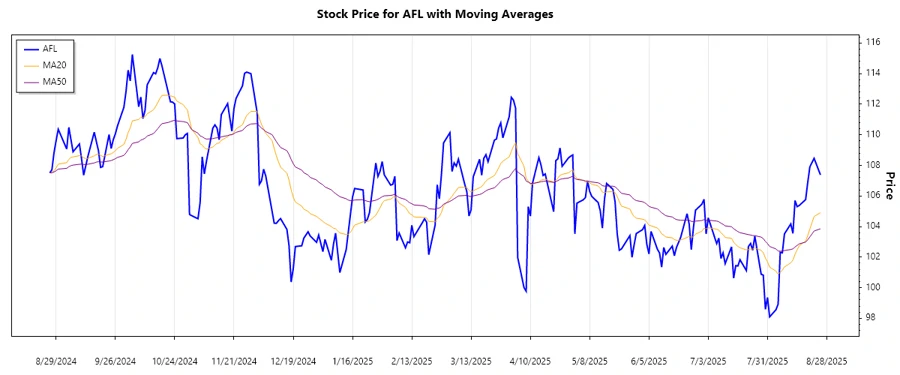
The analysis of the EMA20 and EMA50 indicates that the current trend is an uptrend (EMA20 > EMA50), suggesting a bullish sentiment in the market. This uptrend, however, should be viewed with caution, especially considering external market factors.
Support and Resistance
| Type | From | To |
|---|---|---|
| Support | $104.50 | $105.00 |
| Support | $102.00 | $102.50 |
| Resistance | $108.50 | $109.00 |
| Resistance | $110.00 | $110.50 |
The current price is hovering near a resistance zone. Traders should observe this area closely for any breakouts or reversals which could signify potential trading opportunities.
Conclusion
In conclusion, Aflac Incorporated's stock currently shows a bullish trend. However, with prices near a resistance zone, the potential for a pullback or breakout remains a possibility. Risks involve market volatility and potential decreases in demand. The key support levels provide a cushion for investors, while the resistance levels offer a test for bullish momentum. Analysts should consider both fundamental and technical factors to gauge the direction of the stock effectively.
Smart Data Insight
Master the Perfect Entry & Exit for this Stock
Don't leave your profits to chance. Historically, this stock follows specific seasonal patterns that institutional traders use to maximize returns.
- ✅ Identify the "Golden Buying Window"
- ✅ Avoid high-risk correction cycles
- ✅ Backtested data from the last 20+ years