November 01, 2025 a 05:15 am
AFL: Fibonacci Analysis - Aflac Incorporated
The recent trend for Aflac Incorporated (AFL) suggests a strong upward movement, indicating investor confidence in its current market positioning. Despite fluctuations, the consistent rise in price underscores the strength of the company's strategic initiatives, particularly in its U.S. and Japan segments. Investors are advised to consider possible retracement areas for tactical entries or exits.
Fibonacci Analysis
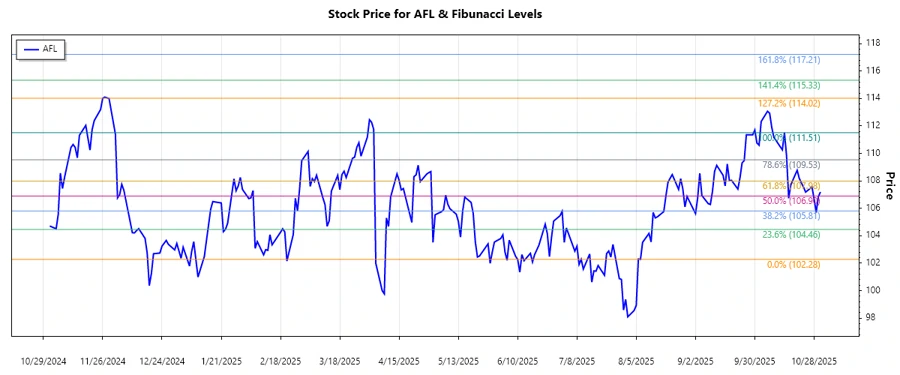
The historical data indicates a dominant upward trend from April 1, 2025, to October 14, 2025. Within this period, the stock price reached its highest point on October 14, 2025, at $111.51, and its lowest point on August 7, 2025, at $102.28. Applying the Fibonacci retracement tool provides key levels that could serve as potential support or resistance zones.
| Metric | Details |
|---|---|
| Trend Start Date | 2025-04-01 |
| Trend End Date | 2025-10-14 |
| High Price & Date | $111.51 on 2025-10-14 |
| Low Price & Date | $102.28 on 2025-08-07 |
| Fibonacci Level | Price Level |
|---|---|
| 0.236 | $109.79 |
| 0.382 | $108.69 |
| 0.5 | $106.89 |
| 0.618 | $105.09 |
| 0.786 | $103.50 |
The current price as of 2025-10-31 is $107.19, placing it close to the 0.5 Fibonacci retracement level. This indicates potential resistance at this level which might signal to traders a point for monitoring possible reversals or continuations.
Conclusion
The upward trend in AFL’s stock demonstrates robust market positioning, leveraging its strong segments in both Japan and the U.S. However, the Fibonacci retracement analysis identifies potential resistance around the current price levels, which might pause the uptrend momentarily. Analysts should watch closely for breaks above key retracement levels, indicating strength, or failures that could suggest a pullback. Strategic positioning can capitalize on potential upward breaks, considering broader market trends and company fundamentals.
Smart Data Insight
Master the Perfect Entry & Exit for this Stock
Don't leave your profits to chance. Historically, this stock follows specific seasonal patterns that institutional traders use to maximize returns.
- ✅ Identify the "Golden Buying Window"
- ✅ Avoid high-risk correction cycles
- ✅ Backtested data from the last 20+ years