
June 02, 2026 a 11:31 am

AFL: Dividend Analysis - Aflac Incorporated
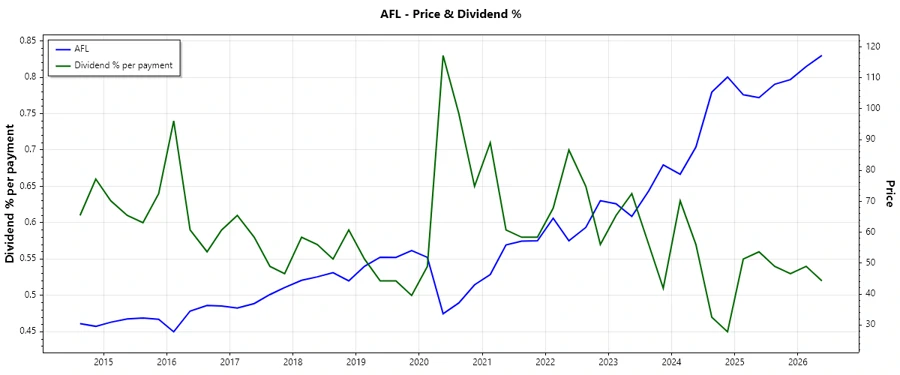
Aflac Incorporated showcases a robust dividend profile with a 2% dividend yield and over four decades of consistent dividend history. Its payout ratio, backed by strong EPS and free cash flows, reflects prudent financial management, although the overall yield remains moderate. Investors may find Aflac's ability to sustain and gradually increase dividends appealing in a stable sector.
📊 Overview
Aflac Incorporated operates in a stable sector, reflected by its impressive dividend history and prudent financial ratios.
| Metric | Value |
|---|---|
| Sector | Insurance |
| Dividend yield | 2.03% |
| Current dividend per share | $2.26 USD |
| Dividend history | 43 years |
| Last cut or suspension | None |
🗣️ Dividend History
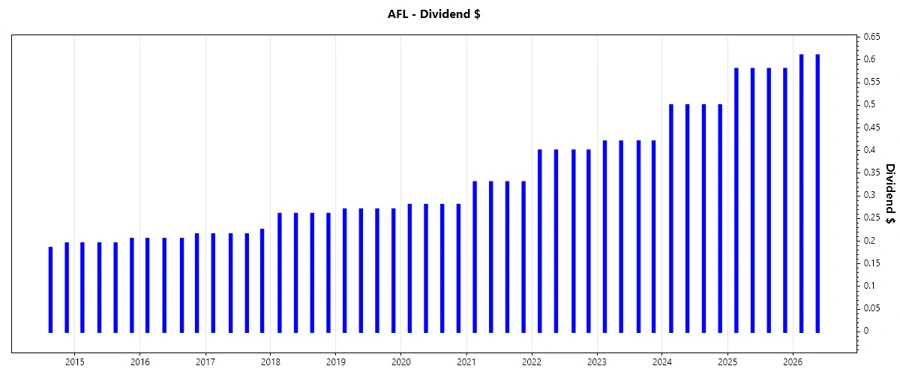
Over the years, Aflac has demonstrated a commitment to rewarding its shareholders, shown through 43 consecutive years of dividend history without suspension or reduction. This stability is a testament to its solid financial positioning within the insurance sector.
| Year | Dividend per Share (USD) |
|---|---|
| 2026 | 1.22 |
| 2025 | 2.32 |
| 2024 | 2.00 |
| 2023 | 1.68 |
| 2022 | 1.60 |
📈 Dividend Growth
Aflac has consistently managed to increase dividends over the past years at moderate rates, providing shareholders with steady growth in income, even if smaller than higher-yielding stocks could offer.
| Time | Growth |
|---|---|
| 3 years | 13.19% |
| 5 years | 15.67% |
The average dividend growth is 15.67% over 5 years. This shows moderate but steady dividend growth.
🔍 Payout Ratio
Aflac’s payout ratios express its capability to sustain its dividends. With an EPS-based payout ratio of 25.01% and a free cash flow-based ratio of 39.21%, Aflac retains enough earnings and cash flows for potential future challenges and expansion.
| Key figure | Ratio |
|---|---|
| EPS-based | 25.01% |
| Free cash flow-based | 39.21% |
The EPS payout ratio of 25.01% and FCF payout ratio of 39.21% indicate a conservative approach, suggesting that dividends are easily covered by earnings and cash flows.
💹 Cashflow & Capital Efficiency
In assessing Aflac's cash flow and capital efficiency, high free cash flow yield and reasonable earnings yield indicate profitability and flexibility to reinvest in its operations.
| Metric | 2023 | 2024 | 2025 |
|---|---|---|---|
| Free Cash Flow Yield | 6.49% | 4.69% | 4.37% |
| Earnings Yield | 9.47% | 9.43% | 6.24% |
| CAPEX to Operating Cash Flow | 0% | 0% | 0% |
| Stock-based Compensation to Revenue | 0% | 0% | 0% |
| Free Cash Flow / Operating Cash Flow Ratio | 1 | 1 | 1 |
The cash flow ratios portray a stable cash generation capability with zero reliance on stock-based compensation, maintaining a balance between operating and free cash flows.
📊 Balance Sheet & Leverage Analysis
Aflac's balance sheet demonstrates moderate leverage, with a debt-to-equity ratio reflecting a conservative financing structure. Its net debt to EBITDA and interest coverage ratios further reinforce its robust financial health.
| Metric | 2023 | 2024 | 2025 |
|---|---|---|---|
| Debt-to-Equity | 33.50% | 28.73% | 28.51% |
| Debt-to-Assets | 5.81% | 6.38% | 7.22% |
| Debt-to-Capital | 25.09% | 22.32% | 22.19% |
| Net Debt to EBITDA | 0.58 | 0.20 | 0.39 |
| Current Ratio | 0 | 0 | 0 |
| Quick Ratio | 0 | 0 | 0 |
| Financial Leverage | 5.76 | 4.50 | 3.95 |
The data underscores Aflac's sound financial structure, allowing operational flexibility and leverage to support growth initiatives without compromising fiscal stability.
📈 Fundamental Strength & Profitability
Aflac’s profitability ratios, such as return on equity and net profit margin, underscore its capability to generate revenues efficiently. Their consistent R&D investments are indicative of sustained innovation and competitive positioning.
| Metric | 2023 | 2024 | 2025 |
|---|---|---|---|
| Return on Equity | 21.19% | 20.86% | 12.36% |
| Return on Assets | 3.68% | 4.63% | 3.13% |
| Net Profit Margin | 24.73% | 28.46% | 20.91% |
| EBIT Margin | 27.93% | 33.55% | 26.67% |
| EBITDA Margin | 27.93% | 33.55% | 31.68% |
| Gross Margin | 100% | 35.63% | 38.93% |
| R&D to Revenue | 0% | 0% | 0% |
Profitability and returns indicate robust operational efficiency, supporting Aflac’s capacity to finance growth while returning capital to shareholders.
📉 Price Development
✅ Dividend Scoring System
| Category | Score | Score Bar |
|---|---|---|
| Dividend yield | 3 | |
| Dividend Stability | 5 | |
| Dividend growth | 4 | |
| Payout ratio | 5 | |
| Financial stability | 4 | |
| Dividend continuity | 5 | |
| Cashflow Coverage | 4 | |
| Balance Sheet Quality | 4 |
Overall Score: 34 out of 40
🔍 Rating
Aflac Incorporated is a strong performer in the dividend space, characterized by its stability and prudent financial strategies. While the yield is moderate, its growth and stability offer a compelling choice for conservative, income-focused investors. The recommendation is to consider Aflac for inclusion in a balanced dividend income portfolio.
Smart Data Insight
Master the Perfect Entry & Exit for this Stock
Don't leave your profits to chance. Historically, this stock follows specific seasonal patterns that institutional traders use to maximize returns.
- ✅ Identify the "Golden Buying Window"
- ✅ Avoid high-risk correction cycles
- ✅ Backtested data from the last 20+ years