February 10, 2026 a 03:31 pm

AFL: Dividend Analysis - Aflac Incorporated
Aflac Incorporated has a robust dividend policy, characterized by consistent growth and a long history of payouts without significant interruptions, as evidenced by 43 years of consecutive dividend payments. The company's strong financial fundamentals support a stable dividend yield of approximately 2.08%. Investors should consider Aflac's sustainable payout ratios and growth potential in their valuation, especially in understanding the company's strategic financial management.
📊 Overview
Aflac's sector position and dividend yield profile highlight its attractiveness to income-focused investors. A long history of uninterrupted dividends and strategic resilience contributes to investor confidence.
| Metric | Value |
|---|---|
| Sector | Insurance |
| Dividend yield | 2.08% |
| Current dividend per share | 1.95 USD |
| Dividend history | 43 years |
| Last cut or suspension | None |
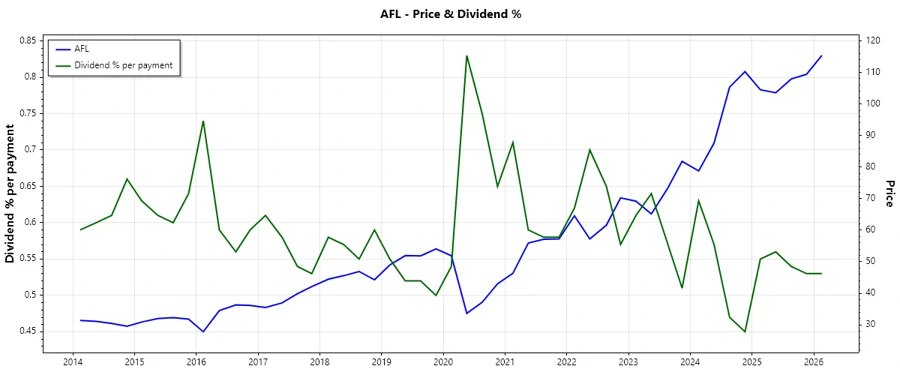
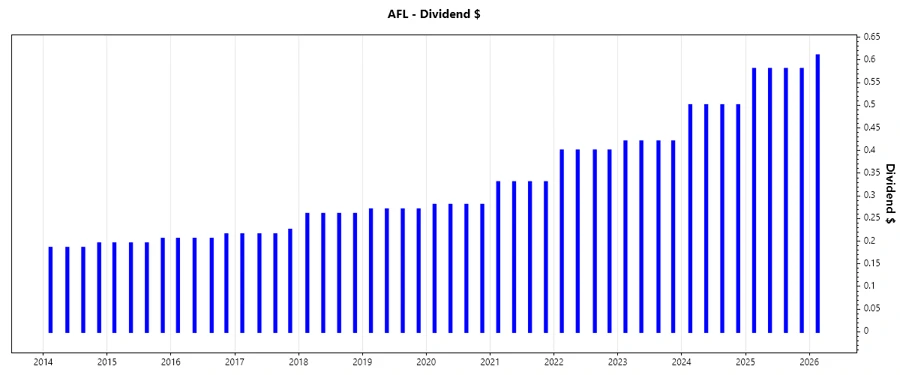
🗣️ Dividend History
The uninterrupted dividend history underscores Aflac's commitment to shareholder returns. This consistent payout history is a strong indicator of financial health and investor reliability.
| Year | Dividend per Share (USD) |
|---|---|
| 2026 | 0.61 |
| 2025 | 2.32 |
| 2024 | 2.00 |
| 2023 | 1.68 |
| 2022 | 1.60 |
📈 Dividend Growth
Consistent dividend growth indicates strong financial performance and strategic foresight, making the stock appealing for growth-oriented investors.
| Time | Growth |
|---|---|
| 3 years | 13.19% |
| 5 years | 15.68% |
The average dividend growth is 15.68% over 5 years. This shows moderate but steady dividend growth.
✅ Payout Ratio
Aflac's payout ratios indicate a healthy balance between reinvestment in the business and rewarding shareholders, ensuring sustainability.
| Key figure | Ratio |
|---|---|
| EPS-based | 24.77% |
| Free cash flow-based | 39.69% |
The low EPS payout ratio of 24.77% and the FCF payout ratio of 39.69% suggest ample room for future dividend increases, reflecting the company's strong earnings retention capacity.
🤑 Cashflow & Capital Efficiency
Examining cash flows and capital efficiency provides insights into the sustainability of dividends and potential for future investments.
| Metric | 2024 | 2023 | 2022 |
|---|---|---|---|
| Free Cash Flow Yield | 4.69% | 6.49% | 8.49% |
| Earnings Yield | 9.43% | 9.47% | 9.67% |
| CAPEX to Operating Cash Flow | 0% | 0% | 0% |
| Stock-based Compensation to Revenue | 0% | 0% | 0% |
| Free Cash Flow / Operating Cash Flow Ratio | 100% | 100% | 100% |
The consistent cash flow ratios highlight Aflac's effectiveness in converting revenues into cash, ensuring the financing of both dividends and business expansion.
⚠️ Balance Sheet & Leverage Analysis
Analyzing the balance sheet and leverage ratios helps in understanding the company's financial stability and risk profile.
| Metric | 2024 | 2023 | 2022 |
|---|---|---|---|
| Debt-to-Equity | 0.29 | 0.33 | 0.37 |
| Debt-to-Assets | 0.064 | 0.058 | 0.056 |
| Debt-to-Capital | 0.22 | 0.25 | 0.27 |
| Net Debt to EBITDA | 0.20 | 0.58 | 0.72 |
| Current Ratio | 0 | 0 | 0 |
| Quick Ratio | 0 | 0 | 0 |
| Financial Leverage | 4.50 | 5.76 | 6.54 |
The steady reduction in leverage ratios reflects Aflac's prudent financial management and low-risk profile, ensuring strong debt servicing capacity and reduced financial risk.
💪 Fundamental Strength & Profitability
Fundamentals and profitability ratios are key indicators of a company's ability to generate earnings and sustain financial health.
| Metric | 2024 | 2023 | 2022 |
|---|---|---|---|
| Return on Equity | 20.86% | 21.19% | 21.94% |
| Return on Assets | 4.63% | 3.68% | 3.35% |
| Net Margin | 28.46% | 24.73% | 23.07% |
| EBIT Margin | 33.55% | 27.93% | 25.42% |
| EBITDA Margin | 33.55% | 27.93% | 25.42% |
| Gross Margin | 35.63% | 100% | 100% |
| R&D to Revenue | 0% | 0% | 0% |
The stable profitability ratios confirm Aflac's competent operational management and ability to capitalize on its assets, essential for continuous dividend payouts and growth.
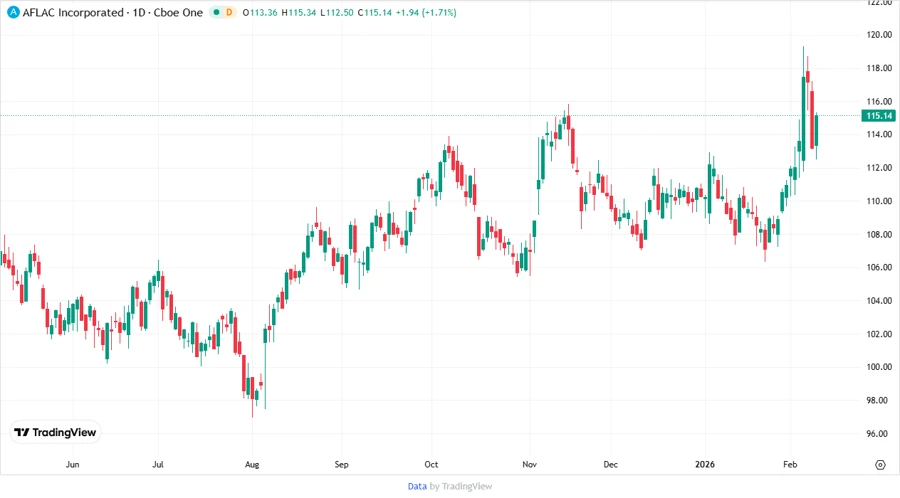
📉 Price Development
🔍 Dividend Scoring System
| Category | Score | |
|---|---|---|
| Dividend yield | 4 | |
| Dividend Stability | 5 | |
| Dividend growth | 4 | |
| Payout ratio | 5 | |
| Financial stability | 5 | |
| Dividend continuity | 5 | |
| Cashflow Coverage | 4 | |
| Balance Sheet Quality | 5 |
Total Score: 37/40
🔗 Rating
Aflac Incorporated stands out with a premium dividend profile supported by strong fundamentals and robust financial stability. It's an attractive choice for conservative dividend investors seeking reliable income and steady growth prospects.
Smart Data Insight
Master the Perfect Entry & Exit for this Stock
Don't leave your profits to chance. Historically, this stock follows specific seasonal patterns that institutional traders use to maximize returns.
- ✅ Identify the "Golden Buying Window"
- ✅ Avoid high-risk correction cycles
- ✅ Backtested data from the last 20+ years