January 16, 2026 a 11:31 am

AFL: Dividend Analysis - Aflac Incorporated
Aflac Incorporated presents a strong dividend profile with a commendable dividend history of 43 consecutive years, which underlines its commitment to returning value to shareholders. Its current dividend yield of 2.13% provides a consistent income stream for investors. The company's cautious and strategic payout ratio further ensures sustainability and growth potential in dividend distributions.
📊 Overview
Aflac Incorporated, a stalwart in the financial sector, exemplifies consistency and reliability. Below is an overview of its pivotal dividend-related parameters.
| Metric | Details |
|---|---|
| Sector | Financial |
| Dividend yield | 2.13% |
| Current dividend per share | 1.95 USD |
| Dividend history | 43 years |
| Last cut or suspension | None |
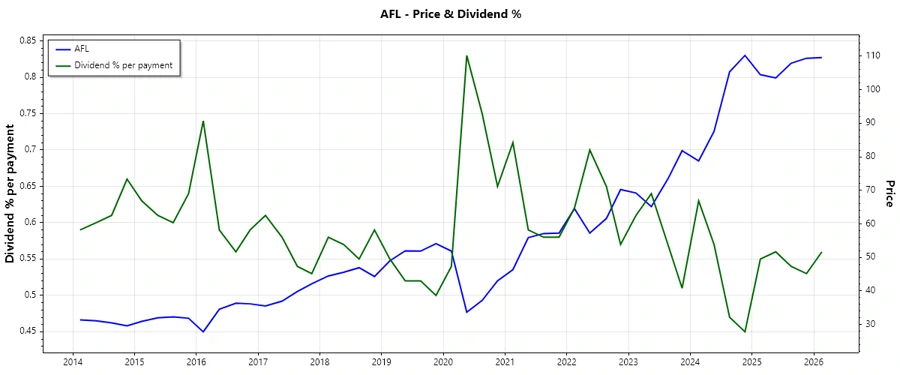
📈 Dividend History
Aflac Incorporated's dividend history is a testament to its commitment to shareholder value. Sustained over decades, this track record is pivotal for income-focused investors prioritizing consistent cash flow.
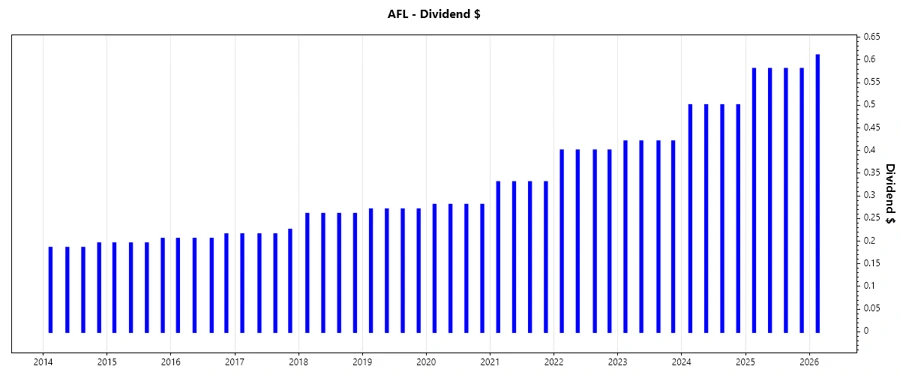
| Year | Dividend per Share (USD) |
|---|---|
| 2026 | 0.61 |
| 2025 | 2.32 |
| 2024 | 2.0 |
| 2023 | 1.68 |
| 2022 | 1.6 |
📈 Dividend Growth
The growth in dividends over the recent years reflects the firm's financial health and its strategic emphasis on enhancing shareholder returns. This is critical for assessing future income potential.
| Time | Growth |
|---|---|
| 3 years | 13.19% |
| 5 years | 15.68% |
The average dividend growth is 15.68% over 5 years. This shows moderate but steady dividend growth.
💵 Payout Ratio
Payout ratios are critical in evaluating whether a company’s dividends are sustainable in the long run. They can indicate if the company is reinvesting enough in its business while maintaining shareholder returns.
| Key figure | Ratio |
|---|---|
| EPS-based | 24.77% |
| Free cash flow-based | 40.50% |
With an EPS payout ratio of 24.77% and a free cash flow-based payout ratio of 40.50%, Aflac Incorporated judiciously balances growth reinvestment with shareholder returns.
📊 Cashflow & Capital Efficiency
Cash flow and capital metrics provide insights into a company's operational efficiency and its ability to finance its operations and growth.
| Metric | 2024 | 2023 | 2022 |
|---|---|---|---|
| Free Cash Flow Yield | 4.69% | 6.49% | 8.49% |
| Earnings Yield | 9.43% | 9.47% | 9.67% |
| CAPEX to Operating Cash Flow | 0% | 0% | 0% |
| Stock-based Compensation to Revenue | 0% | 0% | 0% |
| Free Cash Flow / Operating Cash Flow Ratio | 1 | 1 | 1 |
These metrics indicate a robust cash flow management and capital efficiency, which enhance the company’s overall stability and dividend sustainability.
📊 Balance Sheet & Leverage Analysis
The strength of a balance sheet and leverage indicators are pivotal for understanding financial stability and the risk associated with debt.
| Metric | 2024 | 2023 | 2022 |
|---|---|---|---|
| Debt-to-Equity | 0.29 | 0.33 | 0.37 |
| Debt-to-Assets | 0.064 | 0.058 | 0.056 |
| Debt-to-Capital | 0.22 | 0.25 | 0.27 |
| Net Debt to EBITDA | 0.20 | 0.58 | 0.72 |
| Current Ratio | 0 | 0 | 0 |
| Quick Ratio | 0 | 0 | 0 |
| Financial Leverage | 4.50 | 5.76 | 6.54 |
The company's leverage is kept within prudent levels indicating a strong capacity to manage debt requirements.
📊 Fundamental Strength & Profitability
Understanding fundamental strengths and profitability provides insights into the company’s ability to generate profits and returns for its investors.
| Metric | 2024 | 2023 | 2022 |
|---|---|---|---|
| Return on Equity | 20.86% | 21.19% | 21.94% |
| Return on Assets | 4.63% | 3.68% | 3.35% |
| Net Margin | 28.46% | 24.73% | 23.07% |
| EBIT Margin | 33.55% | 27.93% | 25.42% |
| EBITDA Margin | 33.55% | 27.93% | 25.42% |
| Gross Margin | 35.63% | 100% | 100% |
| Research & Development to Revenue | 0 | 0 | 0 |
Aflac's robust profitability metrics underscore its ability to generate substantial returns on investments, ensuring a solid foundation for dividend growth.
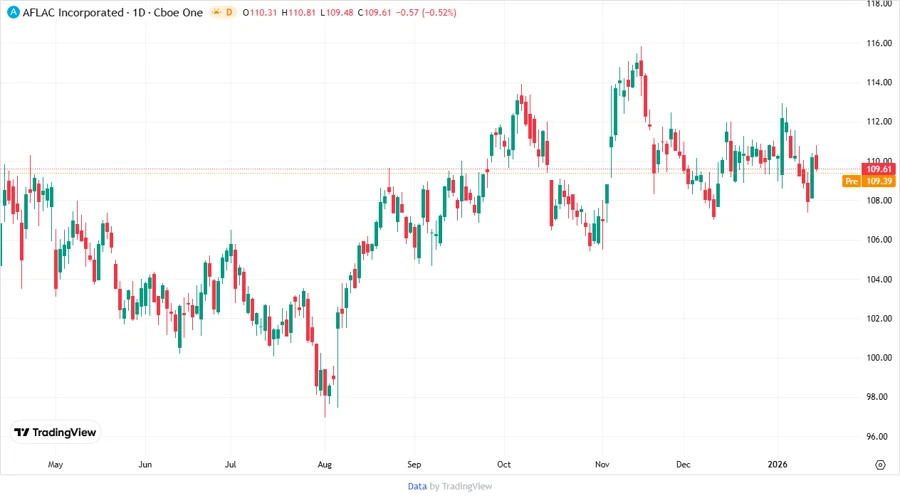
📈 Price Development
📊 Dividend Scoring System
An evaluation of key dividend criteria is summarized below with an intuitive scoring system reflecting the relative strength of each category.
| Criteria | Score | Bar |
|---|---|---|
| Dividend yield | 4 | |
| Dividend Stability | 5 | |
| Dividend growth | 4 | |
| Payout ratio | 5 | |
| Financial stability | 5 | |
| Dividend continuity | 5 | |
| Cashflow Coverage | 5 | |
| Balance Sheet Quality | 4 |
Overall Score: 37/40
✅ Rating
Aflac Incorporated maintains a superior dividend profile exemplified by stable growth, prudent capital management, and robust financial health. Investors seeking reliable dividend yields and growth potential might find Aflac an appealing addition. The comprehensive analysis supports a strong recommendation to hold or accumulate shares.