September 25, 2025 a 07:32 am
AFL: Dividend Analysis - Aflac Incorporated
📊 Aflac Incorporated demonstrates a solid dividend profile characterized by a consistent payment history and moderate growth over time. With a strong dividend yield, the company seems to uphold its reputation for rewarding shareholders. However, investors should keep an eye on payout ratios and financial leverage to ensure this sustainability.
Overview
🔍 In this section, we delve deeper into Aflac's financial metrics, focusing on its dividend yield, sustainability, and historical performance.
| Aspect | Details |
|---|---|
| Sector | Insurance |
| Dividend yield | 2.08 % |
| Current dividend per share | 1.95 USD |
| Dividend history | 42 years |
| Last cut or suspension | None |
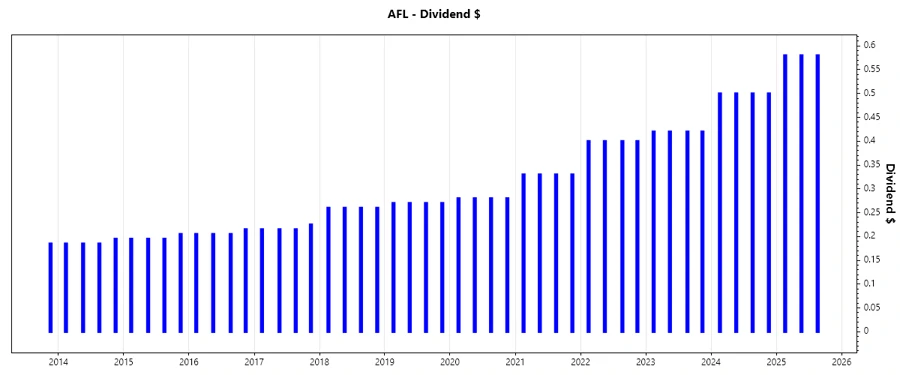
Dividend History
🗣️ Aflac's dividend history indicates stability and reliability, crucial for investors seeking consistent income. This longevity in dividend distribution signifies robust cash flow management.
| Year | Dividend per Share (USD) |
|---|---|
| 2025 | 1.74 |
| 2024 | 2.00 |
| 2023 | 1.68 |
| 2022 | 1.60 |
| 2021 | 1.32 |
Dividend Growth
📈 Understanding dividend growth provides insights into the company's ability to enhance shareholder value. Aflac's steady growth trajectory reflects its strategic earnings growth and dividend policy alignment.📊
| Time | Growth |
|---|---|
| 3 years | 14.86 % |
| 5 years | 13.12 % |
The average dividend growth is 13.12 % over 5 years. This indicates moderate but steady dividend growth, which could be appealing for long-term dividend investors.
Payout Ratio
📉 The payout ratio indicates the proportion of earnings distributed as dividends, essential for understanding dividend safety. A balanced payout ratio implies that dividends are sustainable without severely hindering capital for reinvestment.⚠️
| Key figure | Ratio |
|---|---|
| EPS-based | 42.91 % |
| Free cash flow-based | 40.22 % |
This payout ratio suggests that Aflac is distributing a reasonable portion of its earnings while retaining sufficient capital for future growth, enhancing dividend reliability.
Cashflow & Capital Efficiency
✅ A company's cash flow and capital efficiency metrics are vital for assessing its financial strength. These indicators help understand the firm's capability to generate cash relative to expenses, essential for sustained dividend payouts.
| Year | 2024 | 2023 | 2022 |
|---|---|---|---|
| Free Cash Flow Yield | 4.69 % | 6.49 % | 8.49 % |
| Earnings Yield | 9.43 % | 9.47 % | 9.67 % |
| CAPEX to Operating Cash Flow | 0 % | 0 % | 0 % |
| Stock-based Compensation to Revenue | 0 % | 0 % | 0 % |
| Free Cash Flow/Operating Cash Flow Ratio | 1 | 1 | 1 |
These metrics demonstrate Aflac's strong cash flow generation and efficient capital utilization, supportive of its current dividend strategy.
Balance Sheet & Leverage Analysis
📊 Analyzing balance sheet ratios helps investors gauge financial health and the effectiveness of debt management strategies. Healthy leverage ratios are indicative of the company's ability to meet its long-term obligations.
| Year | 2024 | 2023 | 2022 |
|---|---|---|---|
| Debt-to-Equity | 0.287 | 0.335 | 0.370 |
| Debt-to-Assets | 0.064 | 0.058 | 0.056 |
| Debt-to-Capital | 0.223 | 0.251 | 0.270 |
| Net Debt to EBITDA | 0.198 | 0.581 | 0.719 |
| Current Ratio | - | - | - |
| Quick Ratio | - | - | - |
| Financial Leverage | 4.505 | 5.764 | 6.541 |
Overall, Aflac's leverage ratios suggest robust financial health, indicating manageable debt levels in the context of substantial cash generation.
Fundamental Strength & Profitability
📊 A strong profitability profile underscores the company's competitive value proposition and its capacity to sustain growth and dividends. Essential ratios like ROE and margins showcase Aflac's operational efficiency.
| Year | 2024 | 2023 | 2022 |
|---|---|---|---|
| Return on Equity | 20.86 % | 21.19 % | 21.94 % |
| Return on Assets | 4.63 % | 3.68 % | 3.35 % |
| Net Margin | 28.46 % | 24.73 % | 23.07 % |
| EBIT Margin | 33.55 % | 27.93 % | 25.42 % |
| Gross Margin | 40.85 % | 100 % | 100 % |
| R&D to Revenue | 0 % | 0 % | 0 % |
These profitability metrics highlight Aflac's efficiency in generating capital, underscoring its capability to provide attractive returns to shareholders.
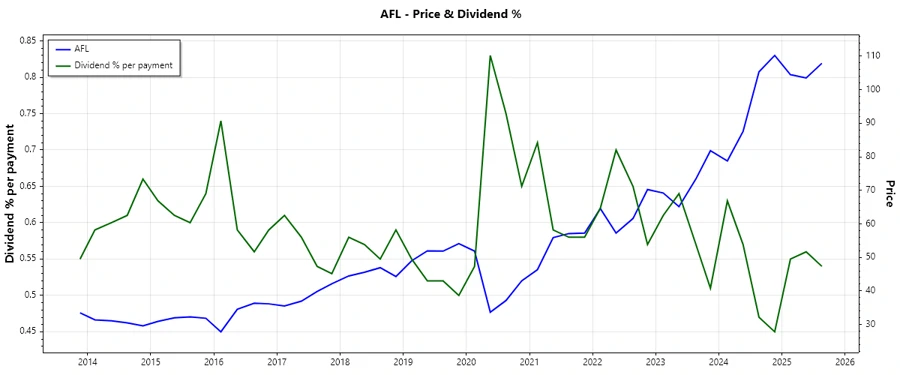
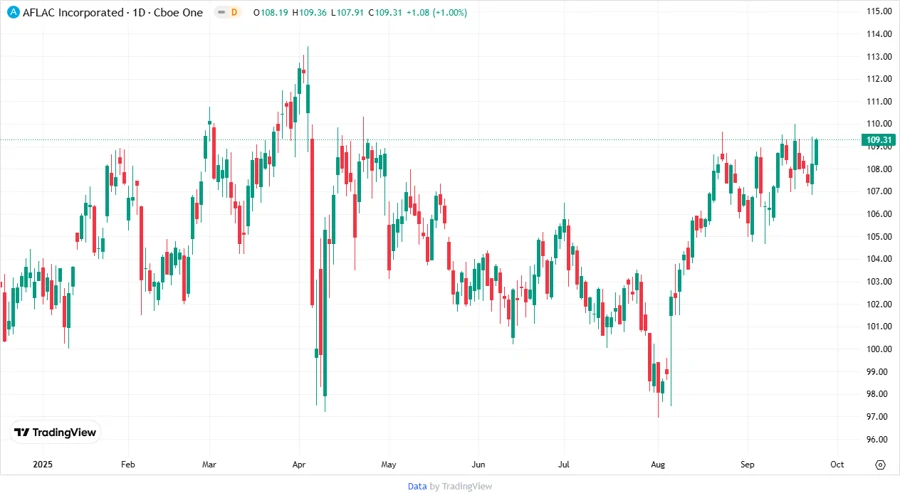
Price Development
Dividend Scoring System
📊 This section evaluates Aflac's dividend score, which aggregates various financial criteria crucial for dividend investors.
| Category | Score | Evaluation |
|---|---|---|
| Dividend yield | 4 | |
| Dividend Stability | 5 | |
| Dividend Growth | 4 | |
| Payout Ratio | 4 | |
| Financial Stability | 4 | |
| Dividend Continuity | 5 | |
| Cashflow Coverage | 5 | |
| Balance Sheet Quality | 4 |
Overall Score: 35/40
Rating
✅ Based on the dividend scoring criteria, Aflac Incorporated exhibits exceptional performance in terms of dividend distribution, stability, and growth. The company's strong financial health and effective capital management strategies support a positive outlook. For investors seeking a balance of reliable income and growth potential, Aflac stands out as a compelling choice in the dividend stock space.
Smart Data Insight
Master the Perfect Entry & Exit for this Stock
Don't leave your profits to chance. Historically, this stock follows specific seasonal patterns that institutional traders use to maximize returns.
- ✅ Identify the "Golden Buying Window"
- ✅ Avoid high-risk correction cycles
- ✅ Backtested data from the last 20+ years