June 27, 2026 a 08:15 am


AES: Trend and Support & Resistance Analysis - The AES Corporation
The AES Corporation has shown varied performance in recent months. Despite some instances of volatility, a dominant trend can be identified. Through the implementation of renewable energy projects, AES remains committed to sustainable growth. Investors should be aware of both emerging opportunities and existing risks. The technical outlook provides valuable insight into potential future movements.
Trend Analysis
| Date | Closing Price | Trend |
|---|---|---|
| 2026-06-26 | $14.67 | ⚖️ Sideways |
| 2026-06-25 | $14.66 | ⚖️ Sideways |
| 2026-06-24 | $14.68 | ⚖️ Sideways |
| 2026-06-23 | $14.70 | ▲ Uptrend |
| 2026-06-22 | $14.65 | ▼ Downtrend |
| 2026-06-18 | $14.62 | ▼ Downtrend |
| 2026-06-17 | $14.61 | ▼ Downtrend |
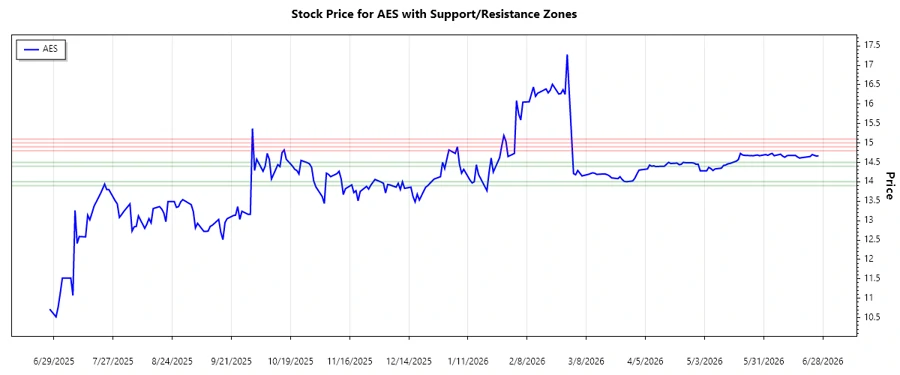
The recent data for AES suggests a predominantly neutral trend with minor fluctuations. The EMA calculations indicate that the stock is trading in a sideways pattern with occasional brief uptrend days.
Support and Resistance
| Zone Type | From | To |
|---|---|---|
| Support | 🟢 $14.40 | 🟢 $14.50 |
| Support | 🟢 $13.90 | 🟢 $14.00 |
| Resistance | 🔴 $15.00 | 🔴 $15.10 |
| Resistance | 🔴 $14.80 | 🔴 $14.90 |
AES is currently within its defined support zone of $14.40 to $14.50. This could suggest a price stabilization, potentially providing a foundation for upward movement.
Conclusion
While AES exhibits a stable sideways trend currently, it remains supported by solid business fundamentals and a strategic focus on renewable energy. It is crucial to continue monitoring support and resistance levels as they may provide early signals for trend changes. The existing support zone offers weaning reassurance, but potential challenges at resistance levels could maintain pressure on upward price movements. Investors are encouraged to weigh these factors carefully to align with their risk profiles and investment strategies.
Smart Data Insight
Master the Perfect Entry & Exit for this Stock
Don't leave your profits to chance. Historically, this stock follows specific seasonal patterns that institutional traders use to maximize returns.
- ✅ Identify the "Golden Buying Window"
- ✅ Avoid high-risk correction cycles
- ✅ Backtested data from the last 20+ years