April 29, 2026 a 01:15 pm
AES: Trend and Support & Resistance Analysis - The AES Corporation
The AES Corporation is currently exhibiting a subtle trend in its stock price, reflecting its diverse power generation and utility operations. Since its incorporation, the company has weathered various market conditions, evident in its stock oscillations over recent months. Investors should attentively consider the technical indicators, including moving averages, support, and resistance levels, to make informed decisions about their investments.
Trend Analysis
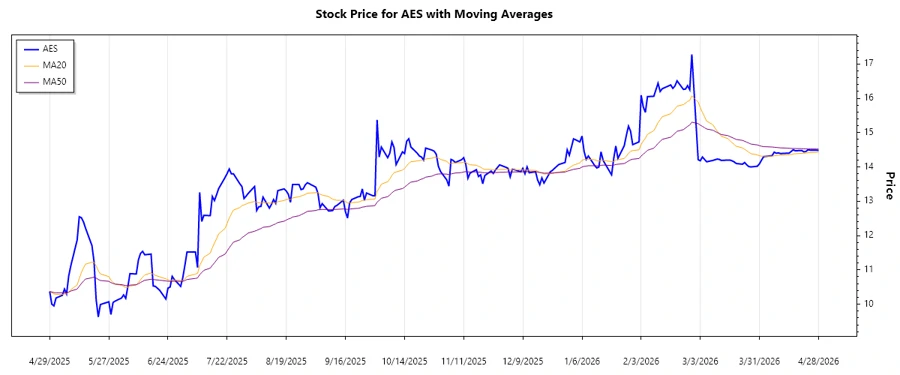
Based on the calculated exponential moving averages (EMA), the moving averages reveal the following indications: the EMA20 indicates a value that is currently below the EMA50, suggesting a downward trend. This signals that the stock is experiencing a slight Abwärtstrend. Consistently over the recent weeks, the price movement has exhibited slight decreases, indicating investor caution in the stock's progression.
| Date | Price | Trend |
|---|---|---|
| 2026-04-28 | 14.48 | ▼ |
| 2026-04-27 | 14.49 | ▼ |
| 2026-04-24 | 14.49 | ▼ |
| 2026-04-23 | 14.50 | ▼ |
| 2026-04-22 | 14.45 | ▼ |
| 2026-04-21 | 14.44 | ▼ |
| 2026-04-20 | 14.48 | ▼ |
This data technically suggests the firm is maintaining an Abwärtstrend with no significant reversals observed in the recent period, emphasizing investor apprehension regarding the stock price.
Support and Resistance
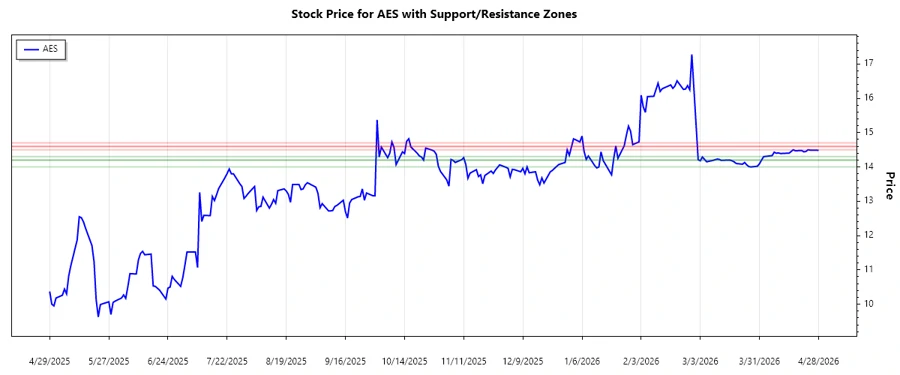
Upon evaluating the close prices, two primary support zones were identified around $14.00 and $14.20. Conversely, resistance has been apparent around $14.50 and $14.60. These levels have served as pivotal benchmarks in the market's interpretation of the current stock value.
| Zone | From | To |
|---|---|---|
| Support Zone 1 | 14.00 | 14.20 |
| Support Zone 2 | 14.20 | 14.30 |
| Resistance Zone 1 | 14.50 | 14.60 |
| Resistance Zone 2 | 14.60 | 14.70 |
The current price is moving near a support zone, specifically between $14.00 and $14.20. If breached, this may signify further declines.
Conclusion
The AES Corporation's stock is currently demonstrating a downward trend, with EMA analysis emphasizing a maintained Abwärtstrend. Investors should remain vigilant of the pivotal support and resistance levels. Should the stock break current support, this may trigger additional declinations. However, a breach above resistance may infer renewed interest and potential reversal. Analyst monitoring should emphasize any breach of these levels for strategic decision-making, reflecting the broader utility market dynamics.