April 13, 2026 a 03:15 am


AES: Trend and Support & Resistance Analysis - The AES Corporation
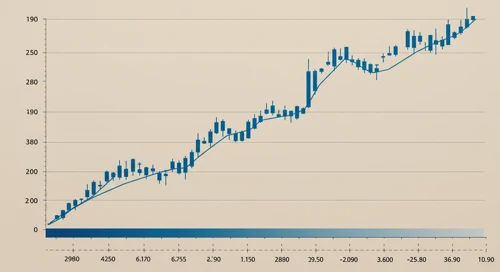
The AES Corporation, operating in a diversified power generation and utility space, shows fluctuations in its stock prices, mirror potential economic shifts and energy market dynamics. Recent stock trends indicate a mix of stability and volatility. As a multinational entity, AES's stock movements could be sensitive to global energy supply and demand factors.
Trend Analysis
The analysis of the closing prices reveals that the trend over the recent seven-day period is indicative of a sideways movement. The EMA20 remains close to the EMA50, suggesting a lack of strong momentum in either direction.
| Date | Close Price | Trend |
|---|---|---|
| 2026-04-10 | 14.39 | ⚖️ Sideways |
| 2026-04-09 | 14.41 | ⚖️ Sideways |
| 2026-04-08 | 14.40 | ⚖️ Sideways |
| 2026-04-07 | 14.43 | ⚖️ Sideways |
| 2026-04-06 | 14.33 | ⚖️ Sideways |
| 2026-04-02 | 14.30 | ⚖️ Sideways |
| 2026-04-01 | 14.20 | ⚖️ Sideways |
Interpretation: The lack of divergence between EMA20 and EMA50 signifies a market indecision, typical in a consolidating market.
Support and Resistance
The data analysis of closing prices helps in identifying key support and resistance zones.
| Zone Type | Start | End | Description |
|---|---|---|---|
| Support | 13.40 | 13.80 | 🔽 Potential buy zone |
| Support | 14.00 | 14.20 | 🔽 Key buy interest |
| Resistance | 14.80 | 15.00 | 🔼 Possible sell zone |
| Resistance | 15.20 | 15.40 | 🔼 Strong sell barrier |
The current price is near a minor support zone, indicating potential for a bounce.
Conclusion
In conclusion, AES's stock exhibits characteristics of a stable market with potential minor fluctuations around the identified support and resistance zones. The moving averages corroborate the stable outlook, giving the stock an edge for safe traders looking for minimal volatility. However, the relatively close support zones could indicate the risks associated with buying low, where false breakdowns might occur. Hence, prudence around the support and resistance thresholds is crucial.