November 27, 2025 a 02:03 pm
AES: Trend and Support & Resistance Analysis - The AES Corporation
The AES Corporation, a diversified power generation and utility company, has shown notable resiliency in the power generation sector. With operations worldwide, the stock price reflects general market trends and company-specific developments. As prices adjust based on various macroeconomic and industry-specific factors, it's imperative to explore both the trend movements and crucial support and resistance levels.
Trend Analysis
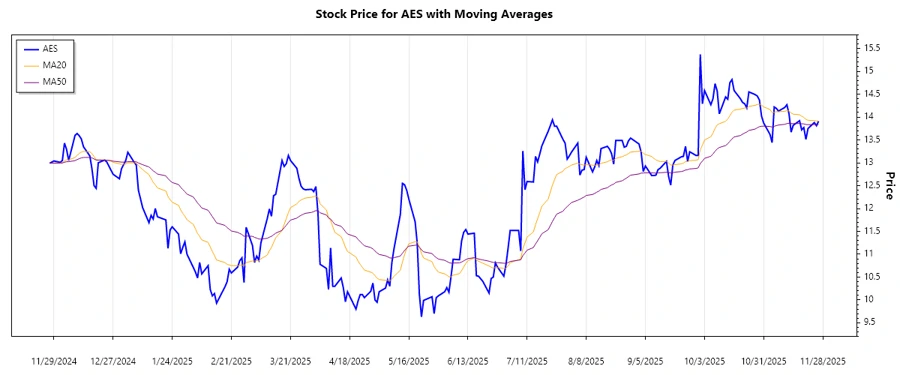
The latest analysis of AES indicates that over the review period, there has been a significant fluctuation in stock price driven by economic and industry-specific factors. Calculating the EMA20 and EMA50, we observed:
| Date | Closing Price | Trend |
|---|---|---|
| Nov 26, 2025 | $13.91 | ⚖️ |
| Nov 25, 2025 | $13.81 | ⚖️ |
| Nov 24, 2025 | $13.88 | ⚖️ |
| Nov 21, 2025 | $13.75 | ⚖️ |
| Nov 20, 2025 | $13.51 | ▲ |
| Nov 19, 2025 | $13.77 | ▲ |
| Nov 18, 2025 | $13.72 | ▲ |
The current trend patterns are indicating a neutral to slightly positive trend as the EMA values showed fluctuations but remained predominantly aligned.
Support and Resistance
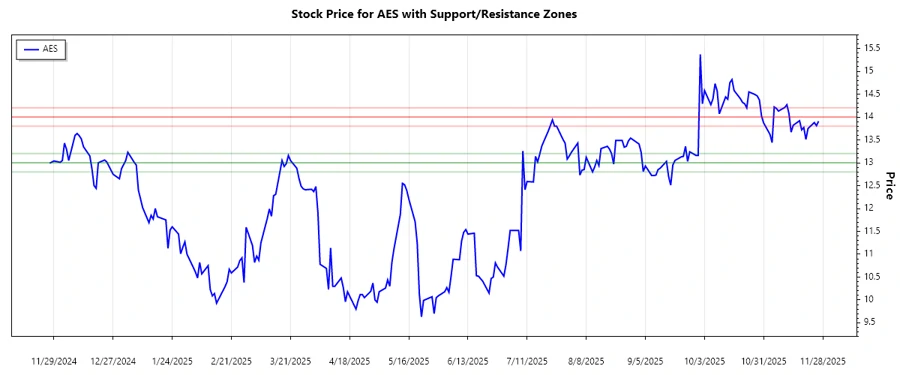
We identified key support and resistance levels over the period:
| Zone Type | From | To |
|---|---|---|
| Support Zone 1 | $13.00 | $13.20 |
| Support Zone 2 | $12.80 | $13.00 |
| Resistance Zone 1 | $14.00 | $14.20 |
| Resistance Zone 2 | $13.80 | $14.00 |
The current closing price is just above the second resistance zone, indicating potential barriers for upward movement without significant buying pressure.
Conclusion
The AES Corporation's stock displays a generally stable trend with brief upward pressures observed. Despite external challenges, AES has maintained a resilient stock performance within the outlined support and resistance zones, suggesting potential consolidation phases ahead. However, breaking past resistance zones requires increased momentum likely driven by market conditions or fundamental shifts. Investors should watch for macroeconomic influences impacting the utility sector, which might affect future price movements.