September 15, 2025 a 08:15 am


AES: Trend and Support & Resistance Analysis - The AES Corporation
The AES Corporation, as a diversified power generation and utility company, leverages various energy sources to maintain operational resilience. Based on the latest technical analysis, the stock has shown fluctuating trends influenced by macroeconomic conditions affecting the energy sector. Understanding the support and resistance levels can offer key insights into potential future movements for investors.
Trend Analysis
The recent historical data for AES suggests a notable trend shift over the past months. Calculating the exponential moving averages (EMAs), a transition phase between trends is observable. The computed EMAs help to substantiate the price action analysis:
| Date | Close | Trend |
|---|---|---|
| 2025-09-12 | 12.88 | ⚖️ Sideways |
| 2025-09-11 | 12.85 | ⚖️ Sideways |
| 2025-09-10 | 12.73 | ⚖️ Sideways |
| 2025-09-09 | 12.72 | ⚖️ Sideways |
| 2025-09-08 | 12.72 | ⚖️ Sideways |
| 2025-09-05 | 12.93 | ⚖️ Sideways |
| 2025-09-04 | 12.81 | ⚖️ Sideways |
The use of EMAs reveals a consolidation phase where the market lacks a decisive direction, indicating a potential zone of accumulation or distribution.
Support and Resistance
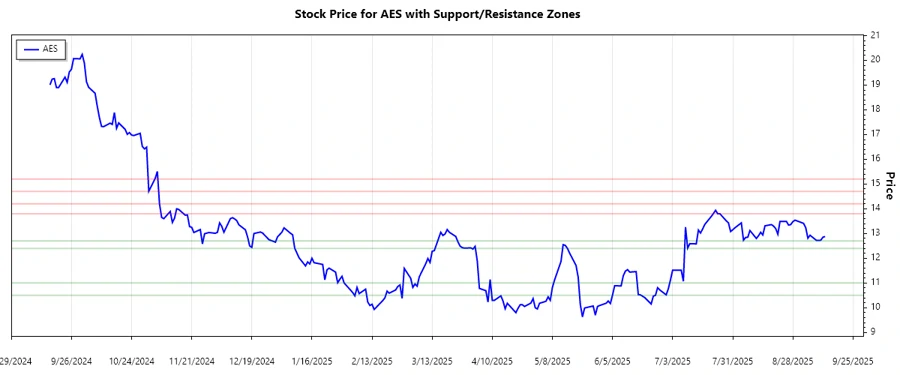
The analysis on support and resistance levels suggests that AES is localized within specific price boundaries. Calculations indicate:
| Zone Type | Price Range |
|---|---|
| Support Zone 1 | 10.50 - 11.00 ▲ |
| Support Zone 2 | 12.40 - 12.70 ▲ |
| Resistance Zone 1 | 13.80 - 14.20 ▼ |
| Resistance Zone 2 | 14.70 - 15.20 ▼ |
Given current pricing, the stock appears to be within the first support zone, suggesting potential buying interest at these levels.
The current pricing context within the support levels points to a rebounding opportunity, contingent upon broader market forces and sector-specific news.
Conclusion
The AES Corporation demonstrates limited risk with potential upside momentum within current technical boundaries. The transitional trend, within well-observed support and resistance zones, suggests that investors should recognize the strategic implications of holding or entering positions within the energy sector. The apparent sideways market motion indicates volatility that could see AES pivot swiftly in response to macro developments or sector-specific changes, offering tactical entry points for risk-appetite investors.
Smart Data Insight
Master the Perfect Entry & Exit for this Stock
Don't leave your profits to chance. Historically, this stock follows specific seasonal patterns that institutional traders use to maximize returns.
- ✅ Identify the "Golden Buying Window"
- ✅ Avoid high-risk correction cycles
- ✅ Backtested data from the last 20+ years