March 18, 2026 a 05:15 am
AES: Fibonacci Analysis - The AES Corporation
The AES Corporation, a global leader in the power generation and utility market, has demonstrated resilience across multiple sectors, leveraging diverse energy sources. With operations spanning continents, AES has adeptly navigated challenging markets. Recent price actions indicate potential for strategic investments based on technical indicators.
Fibonacci Analysis
| Details | Information |
|---|---|
| Trend Type | Upward |
| Start Date | 2025-06-30 |
| End Date | 2026-02-27 |
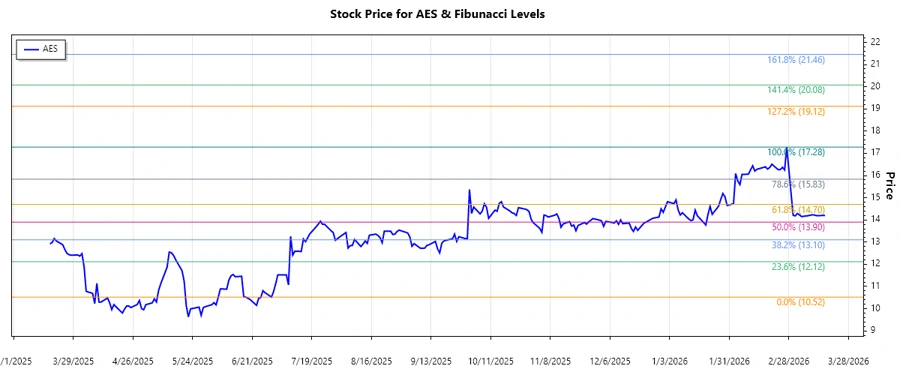
| High Point | $17.28 on 2026-02-27 |
| Low Point | $10.52 on 2025-06-30 |
Fibonacci Retracement Levels
| Retracement Level | Price Level |
|---|---|
| 0.236 | $15.84 |
| 0.382 | $14.86 |
| 0.5 | $13.90 |
| 0.618 | $12.94 |
| 0.786 | $11.77 |
Current price is at $14.20, which suggests it is positioned in the 0.382 retracement zone. This indicates potential support as per Fibonacci analysis.
The Fibonacci levels signal potential support zones that investors might monitor for price consolidation or trend reversals, considering the current upward trend.
Conclusion
AES demonstrates strong growth potential supported by diverse energy sources and geographical presence. The upward trend and current position at significant Fibonacci levels suggest potential bullish support. However, risks remain as market dynamics, such as global economic conditions and energy market shifts, could impact prices. Analysts observe the retracement zones for potential support levels or signs of reversal. Investing decisions should consider broader market trends and company fundamentals alongside technical analysis.