February 11, 2026 a 03:15 pm
AES: Fibonacci Analysis - The AES Corporation
As a diversified power generation and utility company, The AES Corporation has shown resilience and adaptability in a challenging market. Recent trends in the stock price have displayed a significant upward trajectory, indicating investor confidence. This analysis delves into the technical patterns to understand potential price movements using Fibonacci retracement levels.
Fibonacci Analysis
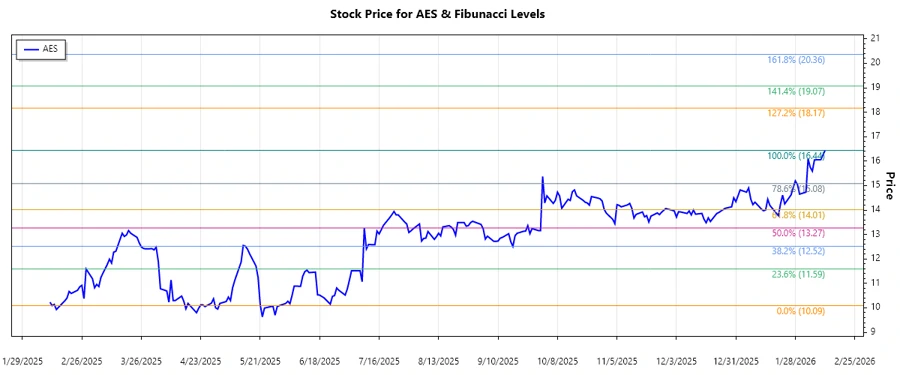
Analyzing the last few months, The AES Corporation stock has demonstrated a clear upward trend. Starting from a low price of $10.09 on February 12, 2025, to a high price of $16.44 on February 11, 2026, this trend provides a basis for Fibonacci analysis.
| Data | Value |
|---|---|
| Trend Start Date | February 12, 2025 |
| Trend End Date | February 11, 2026 |
| High Price & Date | $16.44 on February 11, 2026 |
| Low Price & Date | $10.09 on February 12, 2025 |
Fibonacci Levels:
| Level | Price |
|---|---|
| 0.236 | $14.86 |
| 0.382 | $13.97 |
| 0.5 | $13.27 |
| 0.618 | $12.57 |
| 0.786 | $11.46 |
The current price is around $16.44, which lies outside the Fibonacci retracement zones, indicating a strong upward trend with significant support levels below. Investors might look for potential support near $14.86 and $13.97.
Conclusion
The AES Corporation's stock has shown a robust upward trend, supported by growing investor confidence in its diversified utility operations. While current prices are above Fibonacci retracement levels, suggesting continued bullish momentum, investors should be cautious of potential resistance. There remains the opportunity for strategic buying should the stock retrace back to key support levels, while monitoring macroeconomic factors that could impact utility and energy sectors.