October 11, 2025 a 07:31 am


AES: Dividend Analysis - The AES Corporation
The AES Corporation, with a consistent dividend history spanning over 18 years, offers a moderately attractive dividend yield of 5.29%. Despite experiencing fluctuations in its financial metrics, AES has shown resilience through sustained dividend distributions, making it a noteworthy option for income-focused investors. However, potential investors should carefully consider the company's high debt levels and negative free cash flow yield before committing.
📊 Overview
Analyzing The AES Corporation's dividend profile reveals a company with a history of steady payouts over 18 years, albeit with some financial challenges.
| Metric | Value |
|---|---|
| Sector | Utilities |
| Dividend yield | 5.29% |
| Current dividend per share | 0.6847 USD |
| Dividend history | 18 years |
| Last cut or suspension | None |
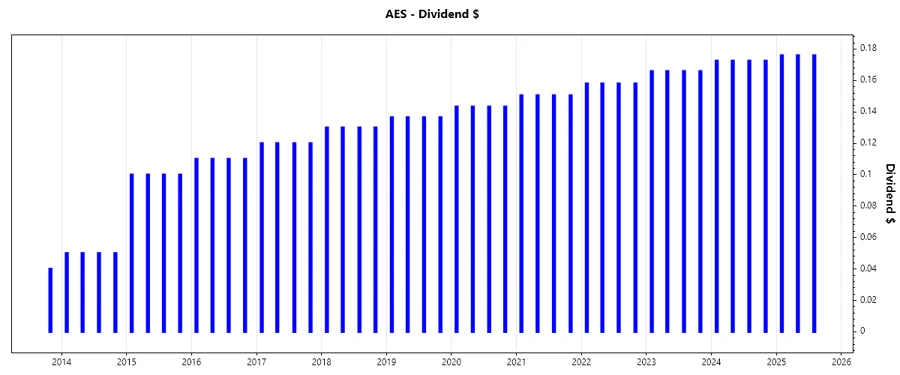
📈 Dividend History
The dividend history of AES shows consistent growth over several years. This aspect is crucial for investors seeking reliable and increasing income over time.
| Year | Dividend per Share (USD) |
|---|---|
| 2025 | 0.528 |
| 2024 | 0.690 |
| 2023 | 0.664 |
| 2022 | 0.632 |
| 2021 | 0.602 |
📈 Dividend Growth
AES has registered a dividend growth rate of 4.65% over the last 3 years and 4.79% over the last 5 years, indicating moderate yet steady growth that could appeal to long-term investors.
| Time | Growth |
|---|---|
| 3 years | 4.65% |
| 5 years | 4.79% |
The average dividend growth is 4.79% over 5 years. This shows moderate but steady dividend growth.
💹 Payout Ratio
The payout ratios provide insights into AES's capacity to maintain and grow its dividends, crucial for assessing potential risks in dividend sustainability.
| Key figure | Ratio |
|---|---|
| EPS-based | 48.20% |
| Free cash flow-based | -19.11% |
The EPS-based payout ratio of 48.20% suggests a relatively safe dividend payout. However, the negative free cash flow-based ratio indicates potential liquidity constraints.
💰 Cashflow & Capital Efficiency
This section provides an analysis of AES's ability to convert revenue into cash flow and its efficiency in capital management, integral for assessing financial health.
| Metric | 2024 | 2023 | 2022 |
|---|---|---|---|
| Free Cash Flow Yield | -51.11% | -36.42% | -9.59% |
| Earnings Yield | 18.57% | 1.88% | -2.85% |
| CAPEX to Operating Cash Flow | 268.60% | 254.58% | 167.62% |
| Stock-based Comp. to Revenue | 0% | 0% | 0% |
| Free Cash Flow / Operating Cash Flow Ratio | -168.60% | -154.58% | -67.62% |
The negative free cash flow yield reflects challenges in generating cash, while a high CAPEX to operating cash flow ratio indicates potential investment inadequacies impacting liquidity.
📊 Balance Sheet & Leverage Analysis
Analyzing AES's balance sheet and leverage helps evaluate the company's financial stability and its ability to service debt.
| Metric | 2024 | 2023 | 2022 |
|---|---|---|---|
| Debt-to-Equity | 796.32% | 1080.31% | 964.22% |
| Debt-to-Assets | 61.21% | 60.00% | 61.25% |
| Debt-to-Capital | 88.84% | 91.53% | 90.60% |
| Net Debt to EBITDA | 7.48 | 10.04 | 11.39 |
| Current Ratio | 0.80 | 0.68 | 1.18 |
| Quick Ratio | 0.73 | 0.61 | 1.01 |
| Financial Leverage | 13.01 | 18.01 | 15.74 |
The high debt-to-equity ratio and increasing net debt to EBITDA suggest substantial leverage, necessitating caution from investors regarding AES's debt service capabilities.
📈 Fundamental Strength & Profitability
An examination of AES's profitability metrics showcases its ability to generate profits relative to revenue and the effectiveness of its financial strategies.
| Metric | 2024 | 2023 | 2022 |
|---|---|---|---|
| Return on Equity | 46.27% | 9.73% | -22.40% |
| Return on Assets | 3.56% | 0.54% | -1.42% |
| Margins: Net | 13.73% | 1.91% | -4.33% |
| EBIT | 19.64% | 11.09% | 7.05% |
| EBITDA | 29.93% | 20.00% | 15.40% |
| Gross | 18.86% | 19.84% | 20.19% |
| R&D to Revenue | 0% | 0% | 0% |
AES's fundamentals reflect mixed profitability, with high returns on equity in 2024 but losses in prior years, indicating potential volatility in earnings and cost management.
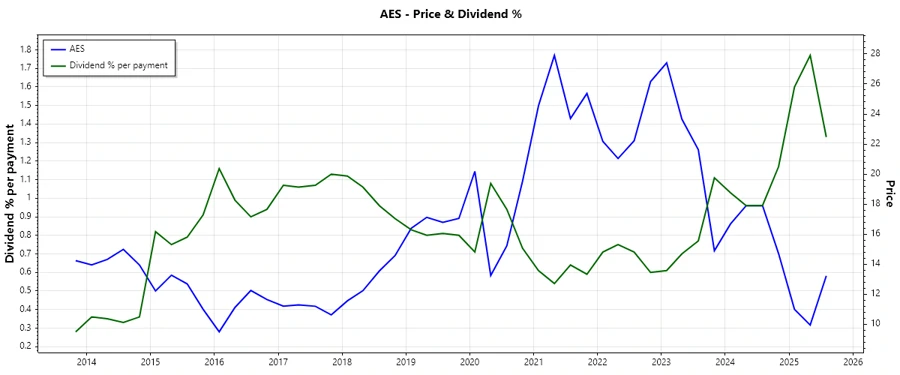
📉 Price Development
🔍 Dividend Scoring System
| Category | Rating | Score |
|---|---|---|
| Dividend yield | 4 | |
| Dividend Stability | 3 | |
| Dividend growth | 3 | |
| Payout ratio | 3 | |
| Financial stability | 2 | |
| Dividend continuity | 4 | |
| Cashflow Coverage | 2 | |
| Balance Sheet Quality | 2 |
Overall Score: 23/40
🗣️ Rating
Based on the comprehensive analysis of The AES Corporation's dividend history, cash flow metrics, and balance sheet, the company presents a moderately attractive dividend investment. However, potential investors should be acutely aware of its high leverage and cash flow challenges, suggesting a cautious approach before investment.
Smart Data Insight
Master the Perfect Entry & Exit for this Stock
Don't leave your profits to chance. Historically, this stock follows specific seasonal patterns that institutional traders use to maximize returns.
- ✅ Identify the "Golden Buying Window"
- ✅ Avoid high-risk correction cycles
- ✅ Backtested data from the last 20+ years