October 22, 2025 a 02:03 pm
AEP: Trend and Support & Resistance Analysis - American Electric Power Company, Inc.
The stock of American Electric Power Company, Inc. (AEP) has shown notable bullish momentum over recent months with a focus on transitioning to a more efficient energy mix. Backed by its diversified energy sources, AEP's financial health is robust, showing recent rises in stock prices. However, potential market volatility and regulatory changes could influence performance.
Trend Analysis
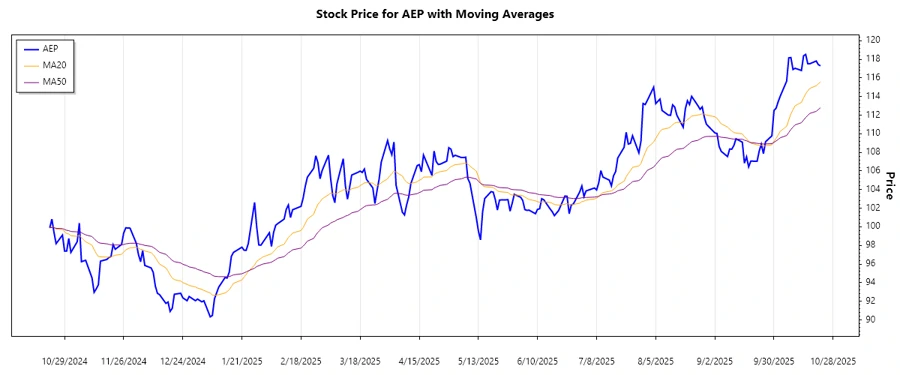
The technical analysis of AEP's recent closing prices has shown a consistent uptrend, defined by positive movements and high volume. Calculating the EMA20 and EMA50 over recent months illustrates continuous bullish momentum.
| Date | Close Price | Trend |
|---|---|---|
| 2025-10-22 | $117.30 | ▲ Uptrend |
| 2025-10-21 | $117.43 | ▲ Uptrend |
| 2025-10-20 | $117.82 | ▲ Uptrend |
| 2025-10-17 | $117.53 | ▲ Uptrend |
| 2025-10-16 | $117.53 | ▲ Uptrend |
| 2025-10-15 | $118.53 | ▲ Uptrend |
| 2025-10-14 | $118.38 | ▲ Uptrend |
In summary, the consistent dominance of EMA20 above EMA50 indicates a continued bullish phase.
Support and Resistance
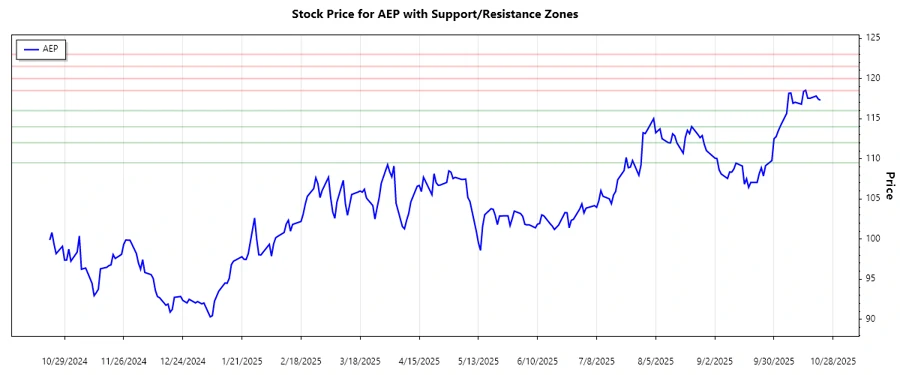
Through analysis, the key support and resistance zones for AEP have been identified. These zones will act as potential areas for buying (support) and selling (resistance) activity.
| Zone Type | Zone From | Zone To |
|---|---|---|
| Support 1 | $109.50 | $112.00 |
| Support 2 | $114.00 | $116.00 |
| Resistance 1 | $118.50 | $120.00 |
| Resistance 2 | $121.50 | $123.00 |
Currently, the price is within the primary resistance zone, indicating potential retracements if selling pressure increases.
Conclusion
The present financial and economic environment, combined with AEP’s stable revenue stream, suggests a generally bullish outlook. However, the presence within a resistance zone raises potential pullback concerns. Investors are advised to monitor closely for any shifts in market dynamics, while strategizing to leverage the company's long-term growth from its diversified energy sources.
Smart Data Insight
Master the Perfect Entry & Exit for this Stock
Don't leave your profits to chance. Historically, this stock follows specific seasonal patterns that institutional traders use to maximize returns.
- ✅ Identify the "Golden Buying Window"
- ✅ Avoid high-risk correction cycles
- ✅ Backtested data from the last 20+ years