September 20, 2025 a 02:03 pm


AEP: Trend and Support & Resistance Analysis - American Electric Power Company, Inc.
American Electric Power Company, Inc. (AEP) is one of the largest electric utilities in the United States. With diverse generation and extensive transmission and distribution systems, AEP is crucial for supplying and marketing electricity to various sectors. Recently, the company's stock has demonstrated fluctuating patterns, indicative of market response to sector-related and broader economic factors.
Trend Analysis
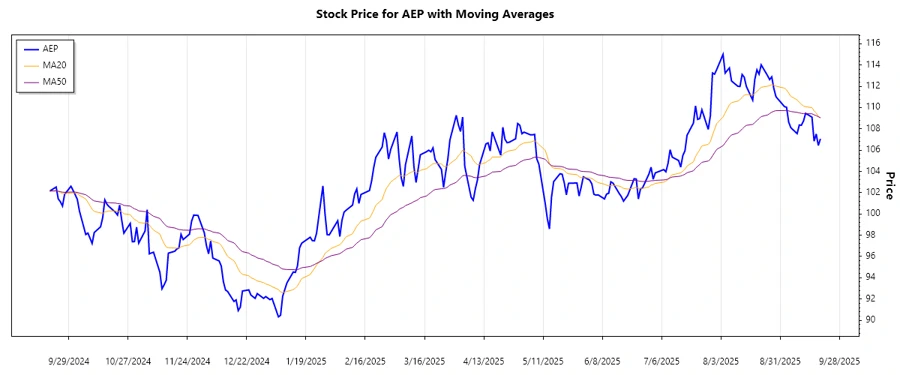
The recent movement in AEP's stock price reflects nuanced market behavior. Calculating the exponential moving averages, EMA20 and EMA50, assists in understanding this pattern.
| Date | Close Price | Trend |
|---|---|---|
| 2025-09-19 | 107.06 | ▼ Abwärtstrend |
| 2025-09-18 | 106.44 | ▼ Abwärtstrend |
| 2025-09-17 | 107.52 | ▼ Abwärtstrend |
| 2025-09-16 | 106.84 | ▼ Abwärtstrend |
| 2025-09-15 | 109.10 | ▼ Abwärtstrend |
| 2025-09-12 | 109.46 | ▼ Abwärtstrend |
| 2025-09-11 | 108.74 | ▼ Abwärtstrend |
The stock has been exhibiting a dominant downward trend, given that EMA20 is consistently below EMA50.
Support and Resistance
Analysis over recent months indicates the following support and resistance zones based on stock price fluctuation.
| Zone | Range | Direction |
|---|---|---|
| Support Zone 1 | 105.00 - 106.00 | 🡻 Approaching |
| Support Zone 2 | 101.00 - 103.00 | 🡻 Approaching |
| Resistance Zone 1 | 109.00 - 110.00 | 🡹 Receding |
| Resistance Zone 2 | 113.00 - 115.00 | 🡹 Receding |
The current price is approaching the first support zone, suggesting a potential stabilization or rebound point depending on market conditions.
Conclusion
AEP's stock has experienced a prevailing downtrend recently, reflecting broader sector challenges. While the support and resistance zones provide potential points for stabilization, continuing market challenges and energy sector dynamics could further influence stock movement. Analysts must keep a close eye on market indicators and potential macroeconomic changes that could impact AEP's operations and stock performance. There are opportunities for investors if support holds, yet caution is advised due to resistance zones approaching, reflecting investor sentiment and market responses.
Smart Data Insight
Master the Perfect Entry & Exit for this Stock
Don't leave your profits to chance. Historically, this stock follows specific seasonal patterns that institutional traders use to maximize returns.
- ✅ Identify the "Golden Buying Window"
- ✅ Avoid high-risk correction cycles
- ✅ Backtested data from the last 20+ years