March 06, 2026 a 11:44 am
AEP: Fibonacci Analysis - American Electric Power Company, Inc.
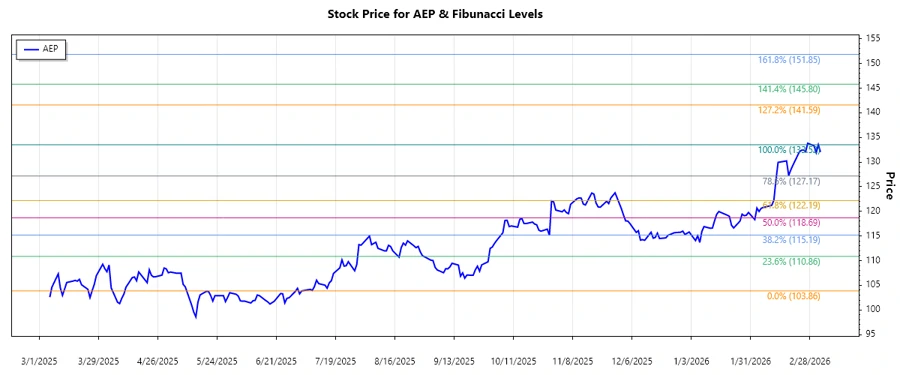
American Electric Power (AEP) has shown significant price movements in recent months. Despite some market volatility, the utility company remains a staple in the industry due to its diversified energy generation and stable demand for electricity. The technical indicators suggest potential areas of support and resistance, providing investors with valuable insights for future price action.
Fibonacci Analysis
| Details | Values |
|---|---|
| Trend Start Date | 2025-07-03 |
| Trend End Date | 2026-03-04 |
| High Point (Price and Date) | $133.52 on 2026-03-04 |
| Low Point (Price and Date) | $103.86 on 2025-07-03 |
| Fibonacci Levels |
|
| Current Price | $132.04 |
| Retracement Zone | None |
| Interpretation | The current price is above the retracement levels, suggesting potential resistance or correction might occur. |
Conclusion
The AEP stock has shown an upward trend over the analyzed period, with significant gains from its low point. Investors should be cognizant of potential resistance at higher retracement levels, indicating corrective pressure could emerge. The energy sector’s dependence on AEP's diversified operations is a backbone for its stock stability. However, energy market volatility and regulatory shifts could pose risks. Overall, maintaining a balanced view on technical and fundamental factors is crucial for evaluating AEP's investment potential.