
July 06, 2026 a 11:31 am


AEP: Dividend Analysis - American Electric Power Company, Inc.
American Electric Power Company, Inc. (AEP) exhibits a strong dividend profile with a notable track record of consistent payments over 57 years. Despite a modest dividend yield of 2.9%, the company's robust history of dividend increases and stable payout ratio presents a reliable income source for investors. AEP's financial stability and strategic growth initiatives further enhance its appeal as a long-term investment option.
📊 Overview
AEP operates within the Utilities sector, a domain known for its stable and predictable dividend payouts. With a current dividend yield of 2.90 %, AEP offers an attractive income stream. The current dividend per share stands at 3.87 USD, underscoring a focus on shareholder returns. The company’s impressive 57-year dividend history with no recent cuts demonstrates resilience and commitment to its dividend policy.
| Metric | Value |
|---|---|
| Sector | Utilities |
| Dividend yield | 2.90 % |
| Current dividend per share | 3.87 USD |
| Dividend history | 57 years |
| Last cut or suspension | None |
🗣️ Dividend History
The historical dividend payments reflect the company’s solid financial performance over the years. Consistent dividend payments indicate a strong commitment to returning capital to shareholders. This is paramount for income-focused investors who prioritize steadiness in cash flow.
| Year | Dividend per Share (USD) |
|---|---|
| 2026 | 1.90 |
| 2025 | 3.74 |
| 2024 | 3.57 |
| 2023 | 3.37 |
| 2022 | 3.17 |
📈 Dividend Growth
Dividend growth is crucial for long-term investors as it increases income potential and hedges against inflation. AEP’s dividend growth over the past few years demonstrates a commitment to enhancing shareholder value.
| Time | Growth |
|---|---|
| 3 years | 5.67 % |
| 5 years | 5.66 % |
The average dividend growth is 5.66 % over 5 years. This shows moderate but steady dividend growth.
✅ Payout Ratio
The payout ratio is a key measure of dividend sustainability, indicating the proportion of earnings or cash flow used for dividends. AEP's EPS-based payout ratio of 57.41% and FCF-based payout ratio of 33.05% suggest a balanced dividend policy, leaving room for reinvestment and future growth.
| Key figure | Ratio |
|---|---|
| EPS-based | 57.41 % |
| Free cash flow-based | 33.05 % |
The payout ratios reflect a cautious approach, balancing shareholder rewards with corporate growth strategies.
💱 Cashflow & Capital Efficiency
Cash flow metrics and capital efficiency offer insights into financial health and operational efficiency, crucial for evaluating dividend-paying ability and sustainability.
| Year | 2025 | 2024 | 2023 |
|---|---|---|---|
| Free Cash Flow Yield | 11.39% | -1.98% | -5.92% |
| Earnings Yield | 5.98% | 6.07% | 5.24% |
| CAPEX to Operating Cash Flow | 1.87% | 114.20% | 149.76% |
| Stock-based Compensation to Revenue | 0% | 0% | 0% |
| Free Cash Flow / Operating Cash Flow Ratio | 98.13% | -14.20% | -49.76% |
The cash flow data suggests operational efficiency challenges in recent years, impacting cash flow stability.
⚖️ Balance Sheet & Leverage Analysis
Evaluating the balance sheet metrics helps understand the company's financial stability, liquidity position, and debt structure.
| Year | 2025 | 2024 | 2023 |
|---|---|---|---|
| Debt-to-Equity | 1.61 | 1.70 | 1.73 |
| Debt-to-Assets | 42.85% | 44.40% | 45.10% |
| Debt-to-Capital | 61.74% | 62.94% | 63.33% |
| Net Debt to EBITDA | 5.35 | 5.63 | 6.01 |
| Current Ratio | 0.45 | 0.44 | 0.53 |
| Quick Ratio | 0.33 | 0.31 | 0.36 |
| Financial Leverage | 3.77 | 3.83 | 3.83 |
Increasing leverage ratios may impose risks, though strong financial management can mitigate potential issues.
📊 Fundamental Strength & Profitability
Profitability metrics like Return on Equity (ROE) and margins provide insight into financial health and the ability to generate profits.
| Year | 2025 | 2024 | 2023 |
|---|---|---|---|
| Return on Equity | 11.50% | 11.01% | 8.75% |
| Return on Assets | 3.05% | 2.88% | 2.28% |
| Margins: Net | 16.43% | 14.90% | 11.39% |
| EBIT | 26.88% | 23.60% | 20.73% |
| EBITDA | 42.90% | 40.64% | 37.17% |
| Gross | 31.81% | 31.92% | 29.02% |
| Research & Development to Revenue | 0% | 0% | 0% |
Strong profitability indicators underscore the capability to sustain dividends while seeking growth opportunities.
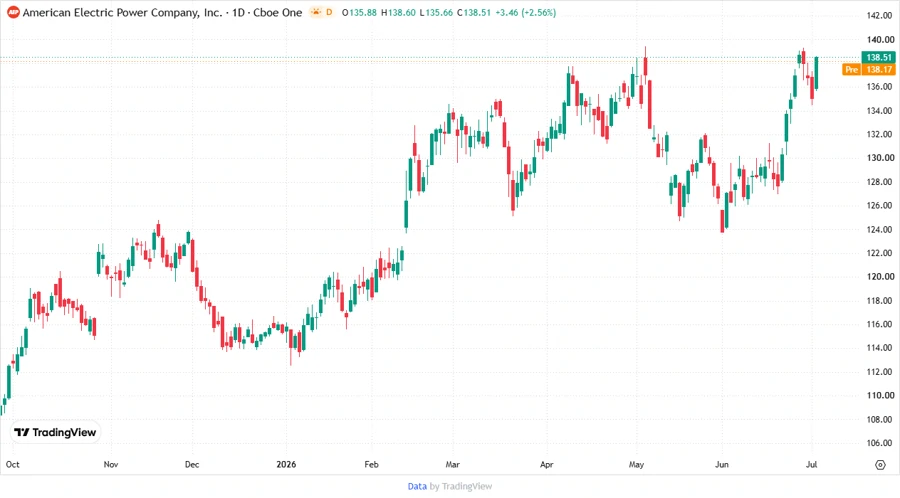
📈 Price Development
🎯 Dividend Scoring System
| Category | Score (1-5) | Score Bar |
|---|---|---|
| Dividend yield | 3 | |
| Dividend Stability | 5 | |
| Dividend Growth | 4 | |
| Payout Ratio | 4 | |
| Financial Stability | 3 | |
| Dividend Continuity | 5 | |
| Cashflow Coverage | 3 | |
| Balance Sheet Quality | 3 |
Overall Score: 30/40
🔍 Rating
Overall, AEP maintains a robust dividend profile supported by its historical performance and moderate, steady growth trajectory. The company's strategic balance between reinvestment and shareholder rewards exemplifies its dedication to long-term investor value. AEP is an appealing investment for those seeking reliable income with potential for modest appreciation.
Smart Data Insight
Master the Perfect Entry & Exit for this Stock
Don't leave your profits to chance. Historically, this stock follows specific seasonal patterns that institutional traders use to maximize returns.
- ✅ Identify the "Golden Buying Window"
- ✅ Avoid high-risk correction cycles
- ✅ Backtested data from the last 20+ years