March 09, 2026 a 03:31 am
AEP: Dividend Analysis - American Electric Power Company, Inc.
The American Electric Power Company (AEP) exhibits a stable dividend profile, underscored by its long-standing dividend history of 57 years. The company’s dividend yield of 3.10% aligns well with the industry averages for utility companies. With a 5-year average dividend growth rate of 5.66%, AEP has demonstrated a solid commitment to shareholder returns while maintaining fiscal responsibility.
📊 Overview
| Sector | Dividend Yield | Current Dividend Per Share | Dividend History | Last Cut or Suspension |
|---|---|---|---|---|
| Utility | 3.10% | 3.87 USD | 57 years | None |
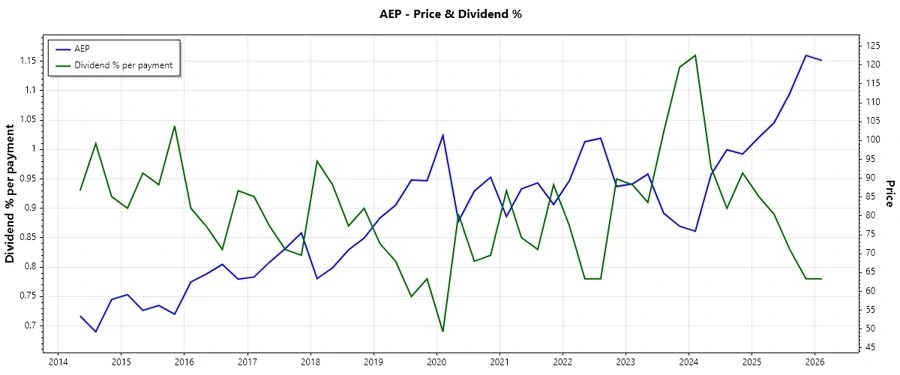
🗣️ Dividend History
The dividend history is a testament to AEP’s capacity to sustain shareholder value through consistent payouts. This long-term reliability is crucial in volatile economic climates.
| Year | Dividend Per Share (USD) |
|---|---|
| 2026 | 0.95 |
| 2025 | 3.74 |
| 2024 | 3.57 |
| 2023 | 3.37 |
| 2022 | 3.17 |
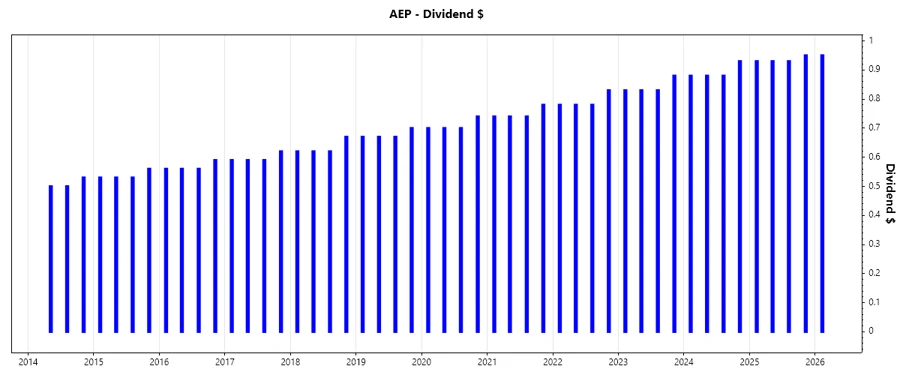
📈 Dividend Growth
AEP's growth in dividends indicates its ongoing commitment to enhance shareholder value. This focus on consistent increases is vital for income-focused investors.
| Time | Growth |
|---|---|
| 3 years | 5.67% |
| 5 years | 5.66% |
The average dividend growth is 5.66% over 5 years. This shows moderate but steady dividend growth.
⚠️ Payout Ratio
Evaluating payout ratios helps determine AEP’s ability to maintain its current dividend levels. With an EPS-based payout ratio of 56.09% and FCF-based payout ratio of 30.72%, AEP maintains a healthy balance, ensuring coverage and sustainability.
| Key Figure | Ratio |
|---|---|
| EPS-based | 56.09% |
| Free cash flow-based | 30.72% |
The current payout ratios suggest that AEP has a balanced approach to earnings distribution, ensuring sustainability and potential for growth.
✅ Cashflow & Capital Efficiency
An analysis of cashflow and capital efficiency offers insight into AEP’s operational efficiency and capital allocation strategies. These factors are critical in understanding the company's financial health and future investment potential.
| Metric | 2023 | 2024 | 2025 |
|---|---|---|---|
| Free Cash Flow Yield | -5.92% | 13.63% | 11.39% |
| Earnings Yield | 5.24% | 6.07% | 5.98% |
| CAPEX to Operating Cash Flow | 149.76% | 2.06% | 1.87% |
| Stock-based Compensation to Revenue | 0% | 0% | 0% |
| Free Cash Flow / Operating Cash Flow Ratio | -49.76% | 97.94% | 98.13% |
The strong free cash flow yield and efficient capital allocation illustrate a robust capital strategy, enhancing AEP's capacity to sustain its dividend policy.
📉 Balance Sheet & Leverage Analysis
Analyzing the balance sheet and leverage ratios provides an assessment of AEP's financial stability and its capacity to meet financial obligations. This is paramount for maintaining operational agility and investor confidence.
| Metric | 2023 | 2024 | 2025 |
|---|---|---|---|
| Debt-to-Equity Ratio | 172.73% | 169.85% | 161.35% |
| Debt-to-Assets Ratio | 45.10% | 44.40% | 42.85% |
| Debt-to-Capital Ratio | 63.33% | 62.94% | 61.74% |
| Net Debt to EBITDA | 6.01 | 5.63 | 5.69 |
| Current Ratio | 0.53 | 0.44 | 0.45 |
| Quick Ratio | 0.36 | 0.31 | 0.33 |
| Financial Leverage Ratio | 3.83 | 3.83 | 3.77 |
AEP demonstrates manageable levels of leverage, though the relatively high debt-to-equity ratio necessitates monitoring.
📊 Fundamental Strength & Profitability
Fundamental metrics provide insights into AEP's operational performance and profitability. These indicators are crucial for gauging long-term business viability and investor returns.
| Metric | 2023 | 2024 | 2025 |
|---|---|---|---|
| Return on Equity | 8.75% | 11.01% | 11.50% |
| Return on Assets | 2.28% | 2.88% | 3.05% |
| Return on Invested Capital | 4.45% | 4.96% | 4.71% |
| Net Profit Margin | 11.39% | 14.90% | 16.43% |
| EBIT Margin | 20.73% | 23.60% | 24.33% |
| EBITDA Margin | 37.17% | 40.64% | 40.34% |
| Gross Profit Margin | 29.02% | 31.92% | 31.81% |
| Research & Development to Revenue | 0% | 0% | 0% |
Strong profit margins and returns underscore AEP’s ability to generate value, validating its operational efficiency.
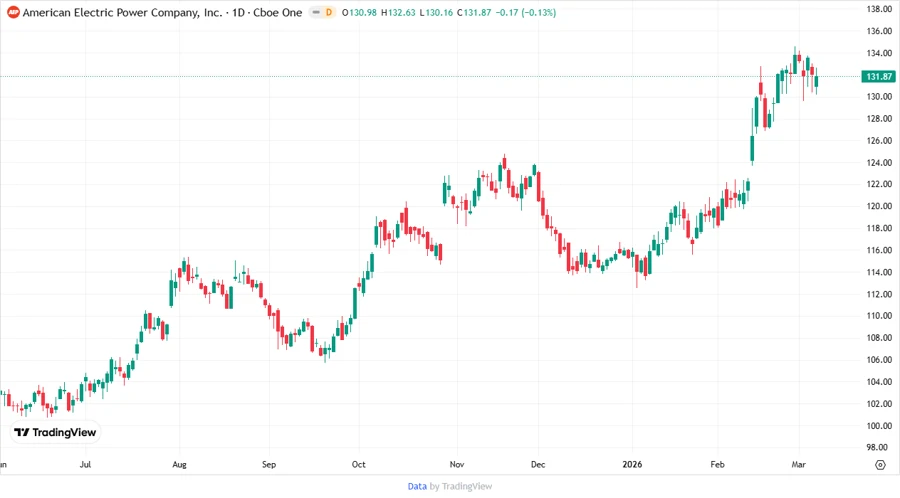
Price Development
📈 Dividend Scoring System
| Criteria | Score | Visual Score |
|---|---|---|
| Dividend Yield | 4 | |
| Dividend Stability | 5 | |
| Dividend Growth | 4 | |
| Payout Ratio | 5 | |
| Financial Stability | 4 | |
| Dividend Continuity | 5 | |
| Cashflow Coverage | 4 | |
| Balance Sheet Quality | 3 |
Total Score: 34/40
Rating
AEP represents a strong dividend opportunity with its long-standing history and solid financial metrics. The company’s consistent dividend growth and stable payout ratios make it a reliable choice for income investors. Given its robust scoring across multiple financial dimensions, AEP earns a favorable recommendation as an investment with potential for steady income and modest growth.
Smart Data Insight
Master the Perfect Entry & Exit for this Stock
Don't leave your profits to chance. Historically, this stock follows specific seasonal patterns that institutional traders use to maximize returns.
- ✅ Identify the "Golden Buying Window"
- ✅ Avoid high-risk correction cycles
- ✅ Backtested data from the last 20+ years