February 05, 2026 a 11:31 am


AEP: Dividend Analysis - American Electric Power Company, Inc.
American Electric Power Company, Inc. offers a steady and attractive dividend history, with consistent payouts over the decades. Its robust market position secures its capacity to maintain these dividends, but potential investors must consider cash flow dynamics and payout ratios that, while sustainable, offer little margin for error. As a utility company, it presents a lower-risk investment, albeit with moderate growth prospects.
📊 Overview
American Electric Power Company, Inc. operates in the Utilities sector, offering a stable dividend yield of 3.13%. The current dividend per share stands at $3.59, maintained over an impressive 57 years of consistent dividend history. Such an enduring streak underscores its reliability as a dividend payer.
| Metric | Details |
|---|---|
| Sector | Utilities |
| Dividend Yield | 3.13 % |
| Current Dividend Per Share | $3.59 |
| Dividend History | 57 years |
| Last Cut or Suspension | None |
📈 Dividend History
Consistent dividends reflect the financial health and stability of a company. They serve as a critical measure for investors seeking regular income, underscoring reliability amidst market fluctuations.
| Year | Dividend Per Share |
|---|---|
| 2026 | $0.95 |
| 2025 | $3.74 |
| 2024 | $3.57 |
| 2023 | $3.37 |
| 2022 | $3.17 |
📉 Dividend Growth
Examining dividend growth provides insight into a company's capacity to enhance shareholder value over time, reflecting both business expansion and fiscal health.
| Time | Growth |
|---|---|
| 3 years | 5.67 % |
| 5 years | 5.66 % |
The average dividend growth is 5.66% over 5 years. This shows moderate but steady dividend growth.
✅ Payout Ratio
Payout ratios inform us about the sustainability of a company's dividends by comparing them against earnings and cash flows, highlighting potential constraints or opportunities for reinvestment.
| Key figure | Ratio |
|---|---|
| EPS-based | 52.46 % |
| Free cash flow-based | 88.78 % |
The EPS-based payout ratio of 52.46% suggests dividends are well-covered by earnings, while the higher FCF-based payout ratio of 88.78% signals tighter cash flow coverage.
🗣️ Cashflow & Capital Efficiency
Monitoring cash flow and capital efficiency is crucial for assessing a company's operational performance and long-term viability. Metrics such as free cash flow yield and capital expenditure ratios provide insights into resource allocation and sustainability.
| Metric | 2024 | 2023 | 2022 |
|---|---|---|---|
| Free Cash Flow Yield | 13.63 % | -5.92 % | -3.05 % |
| Earnings Yield | 6.07 % | 5.24 % | 4.75 % |
| CAPEX to Operating Cash Flow | 2.06 % | 149.76 % | 128.07 % |
| Stock-based Compensation to Revenue | 0 % | 0 % | 0.33 % |
| Free Cash Flow / Operating Cash Flow Ratio | 97.94 % | -49.76 % | -28.07 % |
The company's cash flow metrics denote fluctuating free cash flow yields but show improvement in recent fiscal practice, emphasizing operational agility.
🗣️ Balance Sheet & Leverage Analysis
Analyzing balance sheet metrics helps in measuring liquidity, debt management, and overall financial stability, providing a crucial window into financial resilience amid economic shifts.
| Metric | 2024 | 2023 | 2022 |
|---|---|---|---|
| Debt-to-Equity | 1.70 | 1.73 | 1.74 |
| Debt-to-Assets | 44.40% | 45.10% | 44.50% |
| Debt-to-Capital | 62.94% | 63.33% | 63.51% |
| Net Debt to EBITDA | 5.63 | 6.01 | 5.79 |
| Current Ratio | 0.44 | 0.51 | 0.51 |
| Quick Ratio | 0.31 | 0.36 | 0.41 |
| Financial Leverage | 3.83 | 3.83 | 3.91 |
An elevated level of leverage is evident, necessitating vigilant debt management to safeguard against potential economic downturns.
🗣️ Fundamental Strength & Profitability
Evaluating profitability ratios and fundamentals is essential in determining a company's operational effectiveness and potential for sustained growth, alongside trends in return metrics and operating margins.
| Metric | 2024 | 2023 | 2022 |
|---|---|---|---|
| Return on Equity | 11.01% | 8.75% | 9.66% |
| Return on Assets | 2.88% | 2.28% | 2.47% |
| Margins: Net | 14.90% | 11.39% | 11.95% |
| Margins: EBIT | 23.60% | 20.73% | 19.74% |
| Margins: EBITDA | 40.64% | 37.17% | 36.75% |
| Margins: Gross | 31.92% | 29.02% | 25.21% |
| Research & Development to Revenue | 0% | 0% | 0% |
The profitability indicators present a robust operational profile with consistent returns that could prompt strategic reinvestments.
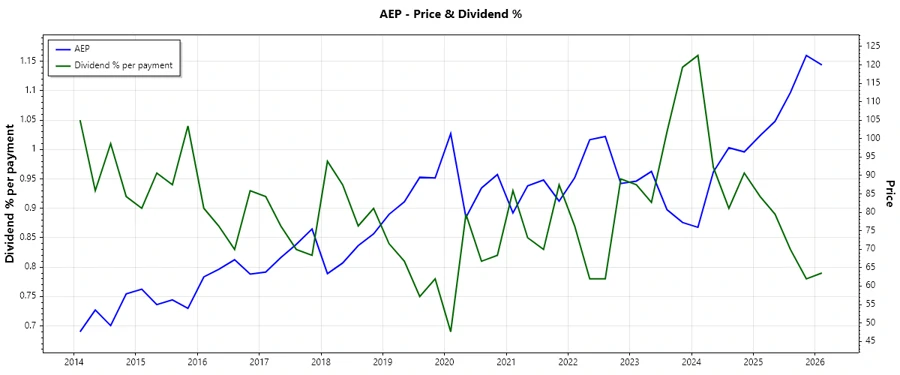
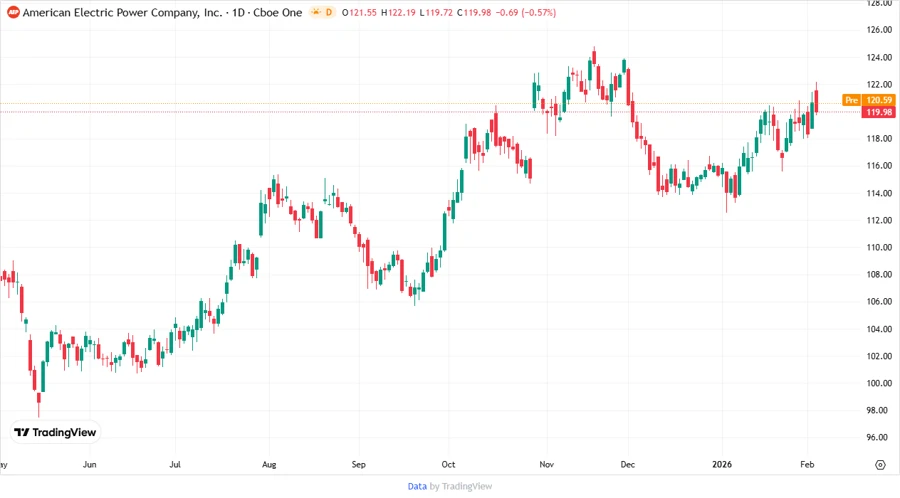
🗣️ Price Development
✅ Dividend Scoring System
This bespoke scoresheet evaluates eight critical dividend-related factors to yield an overall appraisal of dividend potential and sustainability.
| Criteria | Score | Bar |
|---|---|---|
| Dividend Yield | 4 | |
| Dividend Stability | 5 | |
| Dividend Growth | 3 | |
| Payout Ratio | 3 | |
| Financial Stability | 4 | |
| Dividend Continuity | 5 | |
| Cashflow Coverage | 3 | |
| Balance Sheet Quality | 3 |
Overall Score: 30/40
🗣️ Rating
In conclusion, American Electric Power Company, Inc. demonstrates resilient financial health and dividend stability, making it a reliable choice for income-focused investors. However, its moderate growth rates and high payout ratio warrant caution. Investors seeking conservative growth might consider it a defensive play in the utility sector.
Smart Data Insight
Master the Perfect Entry & Exit for this Stock
Don't leave your profits to chance. Historically, this stock follows specific seasonal patterns that institutional traders use to maximize returns.
- ✅ Identify the "Golden Buying Window"
- ✅ Avoid high-risk correction cycles
- ✅ Backtested data from the last 20+ years