October 30, 2025 a 02:47 am
AEP: Dividend Analysis - American Electric Power Company, Inc.
American Electric Power Company, Inc. (AEP), with its notable dividend history and consistent yield, presents a compelling case for income-seeking investors. The company's steadfast growth in dividends, coupled with a substantial history of uninterrupted payments, reflects its financial robustness and shareholder commitment. With a current dividend yield of 3.06%, AEP stands out in the Utilities sector for its solid cash flow management and prudent capital allocation strategies.
📊 Overview
| Aspect | Details |
|---|---|
| Sector | Utilities |
| Dividend yield | 3.06% |
| Current dividend per share | 3.59 USD |
| Dividend history | 56 years |
| Last cut or suspension | 2004 |
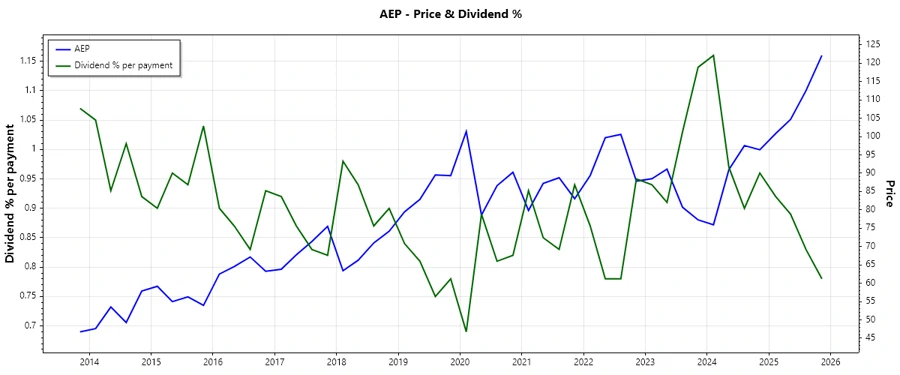
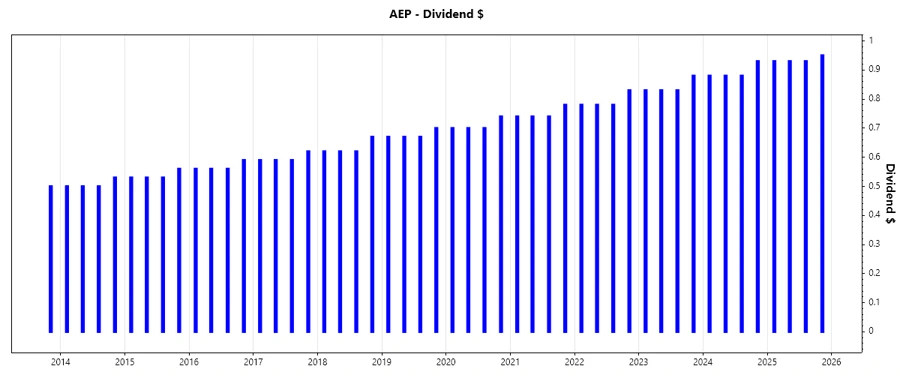
📈 Dividend History
AEP's impressive dividend history cements its status as a reliable dividend-paying company. Maintaining 56 years of consecutive payments showcases the company's strong earnings power and strategic cash flow management, crucial for long-term investor security.
| Year | Dividend per Share (USD) |
|---|---|
| 2025 | 3.74 |
| 2024 | 3.57 |
| 2023 | 3.37 |
| 2022 | 3.17 |
| 2021 | 3.00 |
📈 Dividend Growth
The dividend growth trends for American Electric Power Company indicate a steady increase, vital for beating inflation and providing real income gains to shareholders. Consistent growth underscores robust financial performance and future payout sustainability.
| Time | Growth |
|---|---|
| 3 years | 5.97% |
| 5 years | 5.67% |
The average dividend growth is 5.67% over 5 years. This shows moderate but steady dividend growth.
🗣️ Payout Ratio
Payout ratios are essential metrics indicating the proportion of earnings paid to shareholders in dividends. AEP maintains a sensible balance between rewarding shareholders and retaining earnings for growth.
| Key figure | Ratio |
|---|---|
| EPS-based | 19.15% |
| Free cash flow-based | 89.63% |
The EPS payout ratio of 19.15% is conservative, suggesting ample room for dividend growth, while the FCF payout ratio of 89.63% indicates a high degree of cash flow generation utilized for shareholder returns.
💹 Cashflow & Capital Efficiency
Cash flow and capital efficiency metrics offer insights into a company's ability to generate cash and manage resources efficiently to support dividends and growth.
| Year | 2024 | 2023 | 2022 |
|---|---|---|---|
| Free Cash Flow Yield | 13.63% | -5.92% | -3.05% |
| Earnings Yield | 6.07% | 5.24% | 4.75% |
| CAPEX to Operating Cash Flow | 2.06% | 149.76% | 128.07% |
| Stock-based Compensation to Revenue | 0% | 0% | 0.33% |
| Free Cash Flow / Operating Cash Flow Ratio | 97.94% | -49.76% | -28.07% |
The consistent earnings yield and relatively high free cash flow yield indicate strong cash-generating capabilities, essential for sustainable dividends and future growth prospects.
🗣 Balance Sheet & Leverage Analysis
The balance sheet provides a snapshot of a company's financial standing, evaluating leverage and liquidity critical for assessing risk and long-term solvency.
| Year | 2024 | 2023 | 2022 |
|---|---|---|---|
| Debt-to-Equity | 1.70 | 1.73 | 1.74 |
| Debt-to-Assets | 44.40% | 45.10% | 44.52% |
| Debt-to-Capital | 62.94% | 63.33% | 63.51% |
| Net Debt to EBITDA | 5.63 | 6.01 | 5.79 |
| Current Ratio | 0.44 | 0.53 | 0.51 |
| Quick Ratio | 0.31 | 0.36 | 0.41 |
| Financial Leverage | 3.83 | 3.83 | 3.91 |
AEP's leverage ratios are manageable within its industry, but it maintains a high debt level proportionate to equity and assets, necessitating diligent financial management.
🗣 Fundamental Strength & Profitability
Analyzing fundamental strength and profitability ratios provides deep insights into the company's operational efficiency and ability to maintain competitive advantages.
| Year | 2024 | 2023 | 2022 |
|---|---|---|---|
| Return on Equity | 11.01% | 8.75% | 9.66% |
| Return on Assets | 2.88% | 2.28% | 2.47% |
| Margins: Net | 14.90% | 11.39% | 11.95% |
| Margins: EBIT | 23.60% | 20.73% | 19.74% |
| Margins: EBITDA | 40.64% | 37.17% | 36.75% |
| Margins: Gross | 31.92% | 29.02% | 25.21% |
| Research & Development to Revenue | 0% | 0% | 0% |
Strong margins and returns on equity are indicative of AEP’s effective operational strategies and profitability, supporting its continuous dividend policy.
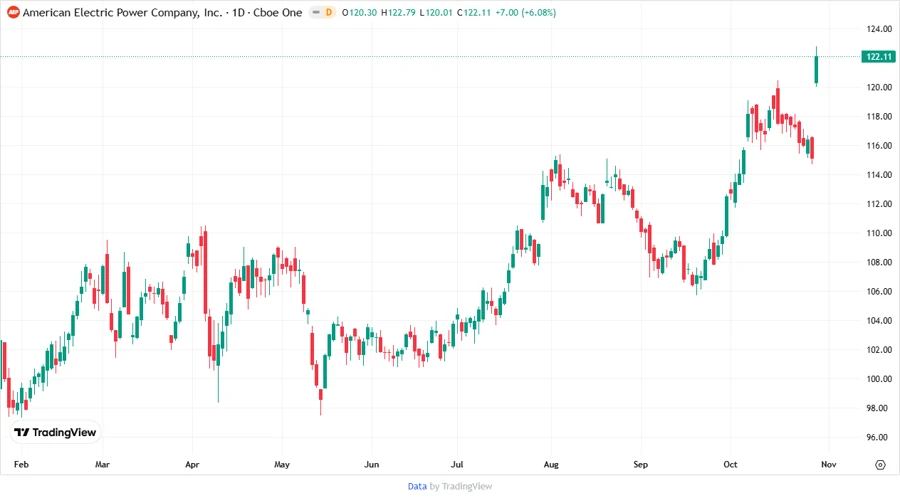
📉 Price Development
📊 Dividend Scoring System
| Criteria | Score (1-5) | Score Bar |
|---|---|---|
| Dividend yield | 4 | |
| Dividend Stability | 5 | |
| Dividend growth | 4 | |
| Payout ratio | 3 | |
| Financial stability | 3 | |
| Dividend continuity | 5 | |
| Cashflow Coverage | 4 | |
| Balance Sheet Quality | 3 |
Total Score: 31/40
✅ Rating
AEP stands as a robust dividend player with commendable history and growth in payouts. While there is room for improvement in financial leverage management, the company’s strategic initiatives and solid yield justify a positive outlook. Recommended for income-focused investors seeking reliability in dividend continuity.
Smart Data Insight
Master the Perfect Entry & Exit for this Stock
Don't leave your profits to chance. Historically, this stock follows specific seasonal patterns that institutional traders use to maximize returns.
- ✅ Identify the "Golden Buying Window"
- ✅ Avoid high-risk correction cycles
- ✅ Backtested data from the last 20+ years