July 11, 2025 a 02:48 am


AEP: Dividend Analysis - American Electric Power Company, Inc.
American Electric Power Company, Inc. is a robust player in the utility sector exhibiting a strong dividend history. With a commendable 56-year record of consistent dividend payments and a current dividend yield of 4.35%, AEP presents itself as a valuable investment for income-focused investors. However, its high EPS payout ratio and negative free cash flow yield suggest areas for cautious monitoring.
📊 Overview
The utility sector, known for its stability, is reflected in AEP's consistent dividend history of 56 years without a cut or suspension. The current dividend per share stands at $3.59, offering a yield of 4.35%, making it attractive for income investors.
| Metric | Value |
|---|---|
| Sector | Utility |
| Dividend Yield | 4.35% |
| Current Dividend Per Share | $3.59 |
| Dividend History | 56 years |
| Last Cut or Suspension | None |
🗣️ Dividend History
Maintaining a continuous dividend payment is crucial for shareholder confidence. AEP's extensive dividend history reflects this stability. Tracking past performances allows investors to assess sustainability and growth over time.
An overview of the most recent dividend payments showcases AEP's commitment to returning value to shareholders.
| Year | Dividend Per Share (USD) |
|---|---|
| 2025 | 1.86 |
| 2024 | 3.57 |
| 2023 | 3.37 |
| 2022 | 3.17 |
| 2021 | 3.00 |
📈 Dividend Growth
Examining dividend growth reveals the potential for increased future payouts. AEP's growth over the last few years underscores a modest but steady increase.
| Time | Growth |
|---|---|
| 3 years | 5.97% |
| 5 years | 5.67% |
The average dividend growth is 5.67% over 5 years. This shows moderate but steady dividend growth.
Payout Ratio
The payout ratio offers insights into a company's dividend sustainability. AEP's EPS-based ratio is 69.31%, which is considered healthy for a utility company, albeit close to the upper end. However, a concerning FCF-based payout ratio of -147.69% indicates the payout is not currently supported by free cash flow, highlighting potential risks.
| Key Figure | Ratio |
|---|---|
| EPS-based | 69.31% |
| Free Cash Flow-based | -147.69% |
Cashflow & Capital Efficiency
Effective cash flow management is vital for financial health and investment capacity. Key metrics suggest FCF yield and EPS challenges. The CAPEX to operating cash flow is above 1, indicating substantial reinvestment, albeit with limited current cash returns.
| Metric | 2024 | 2023 | 2022 |
|---|---|---|---|
| Free Cash Flow Yield | 13.63% | -5.92% | -3.05% |
| Earnings Yield | 6.07% | 5.24% | 4.75% |
| CAPEX to Operating Cash Flow | 2.06% | 149.76% | 128.07% |
| Stock-based Compensation to Revenue | 0% | 0% | 0.32% |
| Free Cash Flow / Operating Cash Flow Ratio | 97.94% | -49.76% | -28.07% |
Balance Sheet & Leverage Analysis
An analysis of leverage and liquidity is essential for understanding debt management and solvency. AEP's debt-to-equity ratio is high at about 1.70, reflecting significant financial leverage and potential risks.
| Metric | 2024 | 2023 | 2022 |
|---|---|---|---|
| Debt-to-Equity | 1.70 | 1.73 | 1.69 |
| Debt-to-Assets | 0.43 | 0.45 | 0.43 |
| Debt-to-Capital | 0.63 | 0.63 | 0.63 |
| Net Debt to EBITDA | 5.63 | 6.01 | 5.62 |
| Current Ratio | 0.44 | 0.52 | 0.65 |
| Quick Ratio | 0.31 | 0.36 | 0.56 |
| Financial Leverage | 3.92 | 3.83 | 3.91 |
Fundamental Strength & Profitability
AEP's profitability figures offer insights into operational efficiency, with margins and asset returns indicating a satisfactory level of cost control and revenue generation.
| Metric | 2024 | 2023 | 2022 |
|---|---|---|---|
| Return on Equity | 11.01% | 8.75% | 9.65% |
| Return on Assets | 2.81% | 2.28% | 2.47% |
| Net Margin | 15.05% | 11.63% | 11.75% |
| Gross Margin | 63.18% | 58.62% | 57.50% |
| EBIT Margin | 23.86% | 21.15% | 19.43% |
| EBITDA Margin | 41.06% | 37.94% | 36.16% |
| R&D to Revenue | 0% | 0% | 0% |
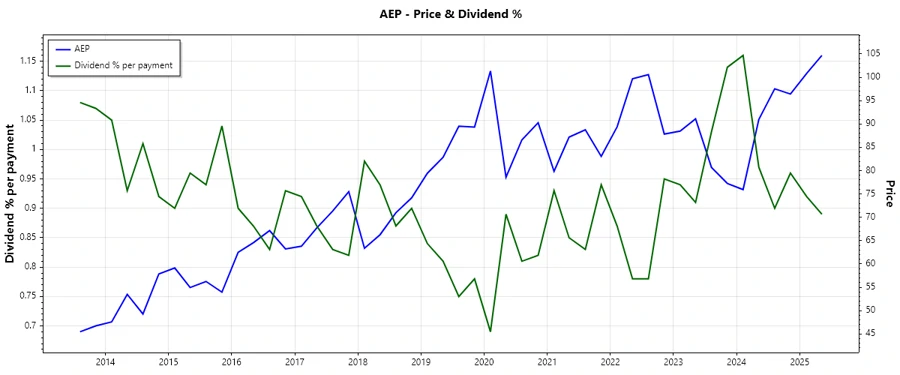
📉 Price Development
✅ Dividend Scoring System
| Criteria | Score | Bar |
|---|---|---|
| Dividend Yield | 4 | |
| Dividend Stability | 5 | |
| Dividend Growth | 3 | |
| Payout Ratio | 2 | |
| Financial Stability | 3 | |
| Dividend Continuity | 5 | |
| Cashflow Coverage | 2 | |
| Balance Sheet Quality | 2 |
Total Score: 26/40
🔍 Rating
Overall, American Electric Power Company, Inc. displays strong fundamentals with consistent dividend payments. While the payout ratios cause some concern, the company's history and current yield make it a viable option for long-term, income-oriented investors. Consider monitoring cash flow developments closely to assess future payout sustainability.
Smart Data Insight
Master the Perfect Entry & Exit for this Stock
Don't leave your profits to chance. Historically, this stock follows specific seasonal patterns that institutional traders use to maximize returns.
- ✅ Identify the "Golden Buying Window"
- ✅ Avoid high-risk correction cycles
- ✅ Backtested data from the last 20+ years