November 19, 2025 a 03:15 am
ADSK: Trend and Support & Resistance Analysis - Autodesk, Inc.
Autodesk, Inc. has demonstrated variability in its stock price movement, indicative of market conditions and internal business dynamics. The company's strong presence in design and engineering software remains a solid foundation, though fluctuations are evident. With recent shifts captured in the data, this analysis navigates technical factors to present strategic insights for stakeholders.
Trend Analysis
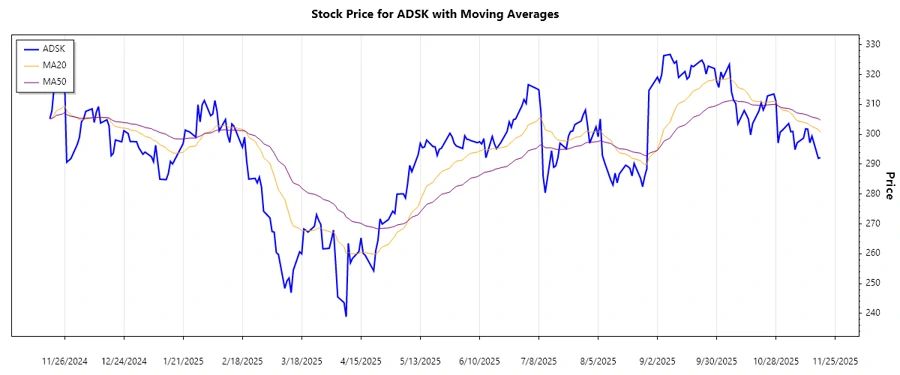
The examination of Autodesk's recent market activity suggests critical insights into the stock's trajectory. Utilizing the EMA (Exponential Moving Average) calculations, we determine the prevalent trend:
| Date | Closing Price | Trend |
|---|---|---|
| 2025-11-18 | $292.23 | ▼ Abwärtstrend |
| 2025-11-17 | $291.96 | ▼ Abwärtstrend |
| 2025-11-14 | $299.39 | ▲ Aufwärtstrend |
| 2025-11-13 | $297.17 | ▼ Abwärtstrend |
| 2025-11-12 | $301.74 | ▲ Aufwärtstrend |
| 2025-11-11 | $301.86 | ▲ Aufwärtstrend |
| 2025-11-10 | $298.72 | ▲ Aufwärtstrend |
EMA calculations reveal a downward market trend, with recent data underscoring the shifts in Autodesk’s stock. Such patterns highlight potential breakout opportunities.
Support- and Resistance
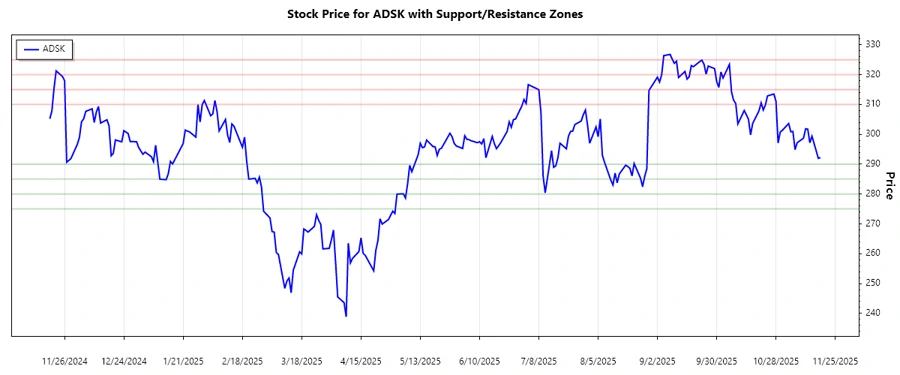
Identifying pivotal support and resistance zones helps anticipate potential price reversals. Based on historical data analysis:
| Zone | From | To |
|---|---|---|
| Support Zone 1 | $285.00 | $290.00 |
| Support Zone 2 | $275.00 | $280.00 |
| Resistance Zone 1 | $310.00 | $315.00 |
| Resistance Zone 2 | $320.00 | $325.00 |
The current price suggests proximity within the identified support zone, indicating a possible price rebound or further decline.
Conclusion
Autodesk's current stock trajectory exemplifies market fluctuations, embedding both opportunities and risks. While support zones offer potential rebounds, resistance zones may cap upward movement. Strategic investments hinge on navigating these patterns, understanding market sentiment, and leveraging trend indicators. Analysts remain vigilant, gauging variables to optimize their actionable insights into price dynamics.
Smart Data Insight
Master the Perfect Entry & Exit for this Stock
Don't leave your profits to chance. Historically, this stock follows specific seasonal patterns that institutional traders use to maximize returns.
- ✅ Identify the "Golden Buying Window"
- ✅ Avoid high-risk correction cycles
- ✅ Backtested data from the last 20+ years