October 13, 2025 a 04:03 am

ADSK: Trend and Support & Resistance Analysis - Autodesk, Inc.
Autodesk, Inc. has shown varied performance over recent months, navigating through the challenging financial landscape. The technical indicators signal a nuanced picture of the company's stock price behavior. Investors are particularly attentive to the recent trends and identified support and resistance levels, which might provide critical insights for strategic decisions. Given the company's substantial market presence in the design and engineering software sector, fluctuations in Autodesk's stock price can present both opportunities and threats.
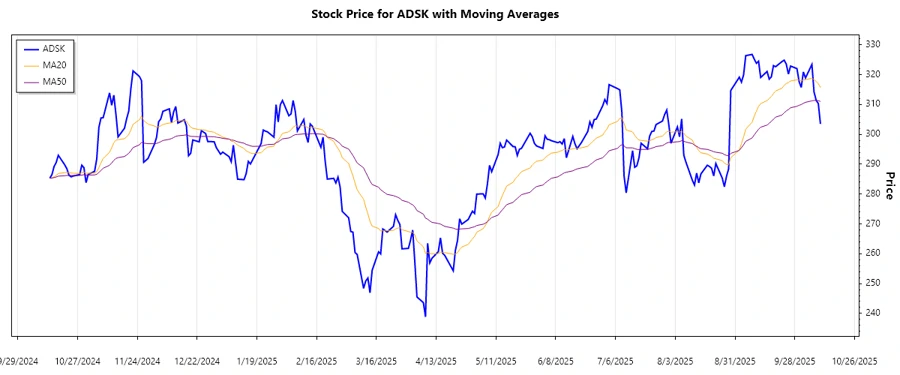
Trend Analysis
| Date | Closing Price | Trend |
|---|---|---|
| 2025-10-10 | 303.5 | ▼ |
| 2025-10-09 | 310.32 | ▲ |
| 2025-10-08 | 311.41 | ▲ |
| 2025-10-07 | 314.19 | ▲ |
| 2025-10-06 | 323.43 | ▲ |
| 2025-10-03 | 318.9 | ▼ |
| 2025-10-02 | 320.91 | ▲ |
The recent price movements suggest a mixed trend with frequent shifts. The EMA calculations indicate that EMA20 is approaching EMA50 without a significant lead, which projects a ⚖️ potential sideways trend for the near future. This indicates market indecision, suggesting that investors should closely monitor for a more decisive movement.
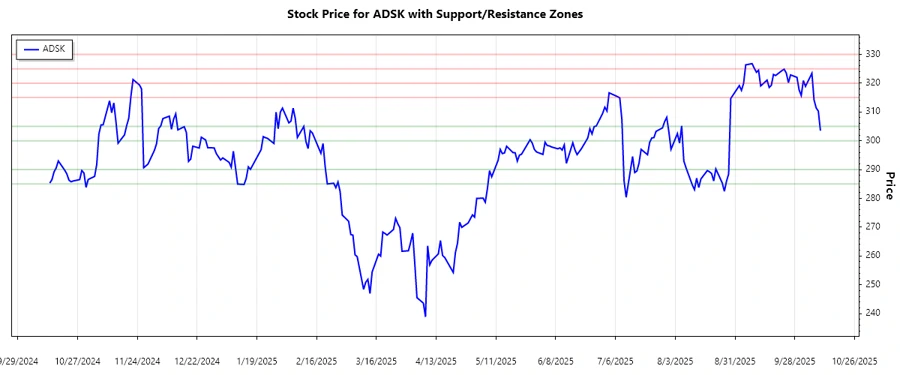
Support and Resistance
| Level Type | From | To |
|---|---|---|
| Support | 285.00 | 290.00 |
| Support | 300.00 | 305.00 |
| Resistance | 315.00 | 320.00 |
| Resistance | 325.00 | 330.00 |
The current price level is inching near the primary resistance zone between $315 and $320. If the price consolidates above this zone, it may signify bullish momentum. However, failure to do so can lead to a downtrend pushing prices back into support zones.
Conclusion
Autodesk, Inc. faces a crucial juncture where the identified support and resistance levels will shape its immediate future. If the stock price breaks through the resistance levels, it may signal a bullish phase. Conversely, inability to break through could lead to bearish tendencies. With Autodesk's strong market offerings and sector presence, these technical signals demand meticulous attention from traders and investors alike.
Smart Data Insight
Master the Perfect Entry & Exit for this Stock
Don't leave your profits to chance. Historically, this stock follows specific seasonal patterns that institutional traders use to maximize returns.
- ✅ Identify the "Golden Buying Window"
- ✅ Avoid high-risk correction cycles
- ✅ Backtested data from the last 20+ years