
July 16, 2026 a 03:15 pm
ADSK: Fibonacci Analysis - Autodesk, Inc.
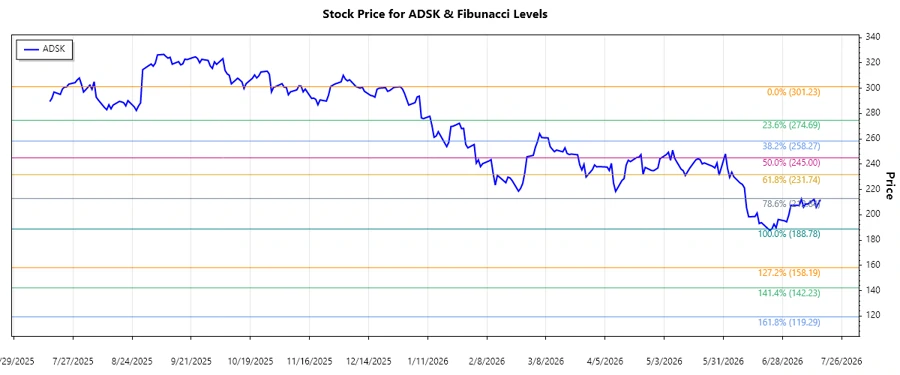
Autodesk, Inc. has demonstrated significant volatility, akin to tech-sector peers, with trends suggesting potential ranges for swings. The company's forward-looking innovations and market conditions continue to influence its stock price dynamics. By utilizing Fibonacci analysis, we assess potential support and resistance levels to understand future price movements.
Fibonacci Analysis
| Analysis Detail | Information |
|---|---|
| Start Date | 2025-12-29 |
| End Date | 2026-07-16 |
| Trend High | $301.23 on 2025-12-29 |
| Trend Low | $188.78 on 2026-06-23 |
| Fibonacci Levels |
|
| Current Price | $211.898 |
| Retracement Zone | None |
| Technical Interpretation | The current price is below the 0.236 Fibonacci level, indicating a potential bounce or continuation of the downward trend unless it moves into a higher retracement zone. |
Conclusion
Despite critical technical levels, the Autodesk stock is showing resilience amidst broader market corrections. Its position below significant Fibonacci levels hints at continued pressure, yet also opportunities for accumulation if the price finds strong support. Risks include further declines if market sentiment weakens, but potential recovery could occur if fundamental growth persists. Investors should monitor key levels for entries as the stock responds to evolving market conditions and internal corporate successes.
Smart Data Insight
Master the Perfect Entry & Exit for this Stock
Don't leave your profits to chance. Historically, this stock follows specific seasonal patterns that institutional traders use to maximize returns.
- ✅ Identify the "Golden Buying Window"
- ✅ Avoid high-risk correction cycles
- ✅ Backtested data from the last 20+ years