November 01, 2025 a 11:45 am

ADSK: Fibonacci Analysis - Autodesk, Inc.
Autodesk, Inc. (Ticker: ADSK) shows a noteworthy performance in the tech industry specializing in 3D design, engineering, and entertainment software. The stock has experienced significant fluctuations, indicative of its exposure to the broader tech market trends. Current data analysis reveals varying levels of support and resistance, crucial for both short-term and long-term investors.
Fibonacci Analysis
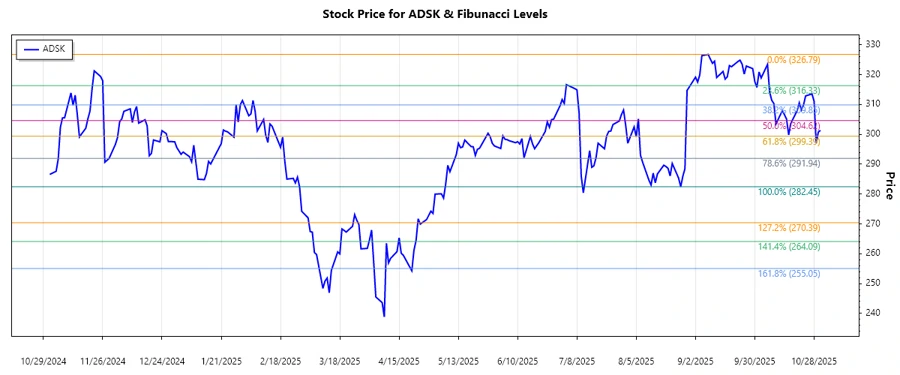
The analysis unveils a dominant downtrend from July 8, 2025, to October 31, 2025, with the high of $326.79 recorded on September 8, 2025, and the low of $282.45 marked on August 26, 2025. This trend guides us to calculate key Fibonacci retracement levels to predict potential support and resistance zones:
| Level | Price |
|---|---|
| 0.236 | $293.40 |
| 0.382 | $299.06 |
| 0.5 | $304.62 |
| 0.618 | $310.18 |
| 0.786 | $317.21 |
Current price analysis shows that the ADSK stock is trading at $301.34, which lies in the 0.382 retracement level. This suggests potential resistance around this area, where previous buying interest might re-emerge.
In conclusion, technical indicators suggest the possibility of enhanced market activity around these retracement levels, acting as possible short-term support and resistance zones.
Conclusion
Autodesk's technical analysis shows a prevalent downtrend within recent months reflecting broader market corrections in tech stocks. While there appears to be some stabilization, potential resistance around the 0.382 Fibonacci retracement level could impact short-term price movements. Investors are advised to monitor these key levels closely for potential shifts in market dynamics. Long-term growth remains promising given Autodesk's strong market position and diversified solutions portfolio, although exposure to market volatility presents risk, demanding cautious buying strategies.
Smart Data Insight
Master the Perfect Entry & Exit for this Stock
Don't leave your profits to chance. Historically, this stock follows specific seasonal patterns that institutional traders use to maximize returns.
- ✅ Identify the "Golden Buying Window"
- ✅ Avoid high-risk correction cycles
- ✅ Backtested data from the last 20+ years