
June 17, 2026 a 04:44 pm

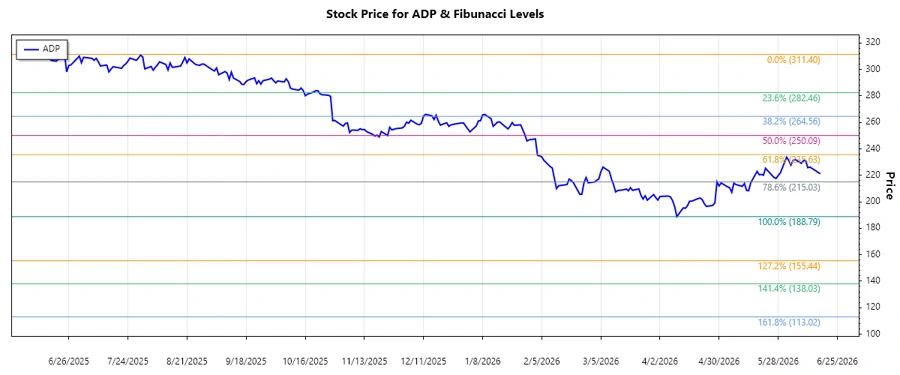
ADP: Fibonacci Analysis - Automatic Data Processing, Inc.
Automatic Data Processing, Inc. (ADP) has shown resilient performance as a global leader in cloud-based HCM solutions. Despite market volatility, ADP continues to leverage its Employer Services and PEO segments, ensuring comprehensive HR solutions that drive client differentiation. By maintaining strong growth metrics and expanding its technological solutions, ADP demonstrates a promising upward trajectory that positions it solidly within its industry.
Fibonacci Analysis
The analysis period shows a dominant downward trend, starting from a high of $311.40 on 2025-06-24 and ending at a low of $188.79 on 2026-04-10. Based on this trend, the following Fibonacci retracement levels have been identified.
| Parameter | Value |
|---|---|
| Trend Start Date | 2025-06-24 |
| Trend End Date | 2026-04-10 |
| High Price | $311.40 |
| Low Price | $188.79 |
| Current Price | $221.22 |
| Fibonacci 23.6% | $218.42 |
| Fibonacci 38.2% | $237.47 |
| Fibonacci 50.0% | $250.10 |
| Fibonacci 61.8% | $262.73 |
| Fibonacci 78.6% | $280.79 |
| Retracement Zone | 0.236 |
| Interpretation | The current price is within the 23.6% retracement level, suggesting potential support but also signifying caution for further movements. |
Conclusion
The technical outlook for ADP reveals potential support around current levels based on the Fibonacci analysis, but caution is advised given the prevailing downtrend. Investors should watch for signs of stabilization before considering long-term positions. While the retracement level suggests a possible bottoming phase, market conditions remain dynamic, necessitating close monitoring of macroeconomic signals and sector-specific developments. Analysts may view the current scenario as an opportunity for adaptive strategies and calculated risk management.
Smart Data Insight
Master the Perfect Entry & Exit for this Stock
Don't leave your profits to chance. Historically, this stock follows specific seasonal patterns that institutional traders use to maximize returns.
- ✅ Identify the "Golden Buying Window"
- ✅ Avoid high-risk correction cycles
- ✅ Backtested data from the last 20+ years