
April 28, 2026 a 07:46 am

📊 ADP: Dividend Analysis - Automatic Data Processing, Inc.
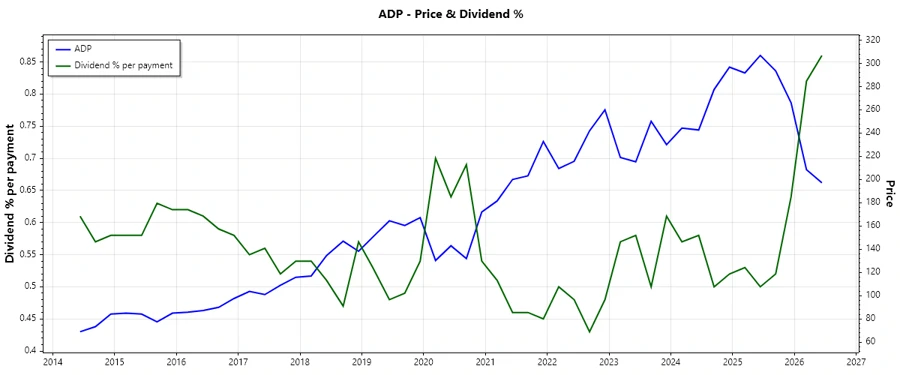
Automatic Data Processing, Inc. (ADP) stands as a robust entity in the software and services sector, renowned for its steadfast dividend policy and consistent payout increases. The company boasts an impressive 44-year history of uninterrupted dividends, underscoring its reliability and shareholder value focus. With a market cap over $79 billion, ADP demonstrates strong financial health, ensuring ongoing stability and potential future growth. The dividend yield at 3.37% is appealing for income-focused investors, while the substantial cash flows further solidify its commitment to rewarding shareholders.
🗣️ Overview
| Metric | Details |
|---|---|
| Sector | Software & Services |
| Dividend Yield | 3.37% |
| Current Dividend per Share | $5.89 USD |
| Dividend History | 44 years |
| Last Cut or Suspension | None |
📉 Dividend History
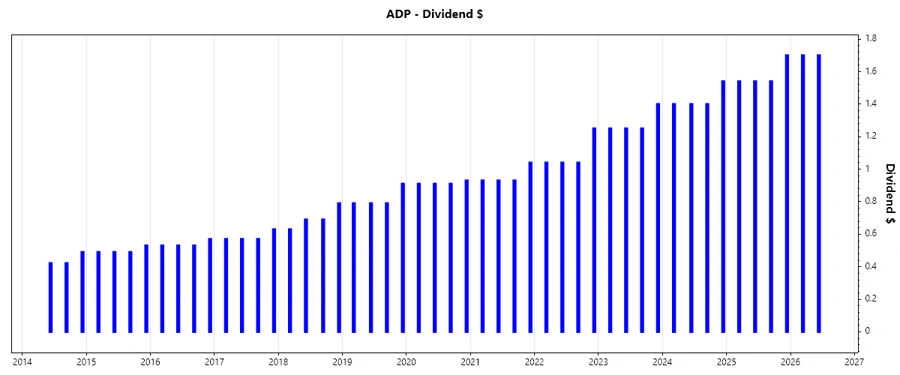
🔎 ADP's resilient dividend history is a testament to its strong financial stewardship and ability to navigate economic challenges. Maintaining a consistent dividend payout showcases the company's robust operational capabilities and strategic management focused on shareholder returns. This record fosters confidence in future dividend reliability, crucial for long-term investors seeking income stability.
| Year | Dividend per Share (USD) |
|---|---|
| 2026 | $3.40 |
| 2025 | $6.32 |
| 2024 | $5.74 |
| 2023 | $5.15 |
| 2022 | $4.37 |
📈 Dividend Growth
📏 The sustained growth in dividends is a reflection of ADP's ability to enhance shareholder value. Analyzing growth provides insights into the company's future payout potential and financial health. Considerable growth performance, despite market fluctuations, underscores the resilience and adaptability of ADP.
| Time | Growth |
|---|---|
| 3 years | 13.09% |
| 5 years | 11.54% |
The average dividend growth is 11.54% over 5 years. This shows moderate but steady dividend growth.
✅ Payout Ratio
Analyze payout ratios to ensure that dividend commitments are sustainable from an income and cash flow perspective. These ratios reflect the degree to which the company can cover its dividends, crucial for assessing dividend risk and sustainability.
| Key figure ratio | Percentage |
|---|---|
| EPS-based | 56.18% |
| Free cash flow-based | 51.62% |
The EPS payout ratio of 56.18% and FCF payout ratio of 51.62% indicate a balanced approach, permitting flexibility to maintain or grow dividend payouts without compromising financial stability.
💰 Cashflow & Capital Efficiency
Understanding cash flow health and capital efficiency is crucial, as it provides insights into the company’s ability to generate free cash without incurring debt and effectively utilize capital.
| Metric | 2025 | 2024 | 2023 |
|---|---|---|---|
| Free Cash Flow Yield | 3.80% | 3.71% | 4.00% |
| Earnings Yield | 3.25% | 3.87% | 3.75% |
| CAPEX/Operating Cash Flow | 3.43% | 13.55% | 13.58% |
| Stock Compensation/Revenue | 1.29% | 1.27% | 1.22% |
| FCF/Operating Cash Flow Ratio | 96.58% | 86.45% | 86.42% |
These metrics illustrate a strong capability in generating cash flows and maintaining capital efficiency, crucial for ongoing investments and dividend payouts.
⚠️ Balance Sheet & Leverage Analysis
A robust balance sheet is key to surviving financial downturns, and leverage analysis helps evaluate the company’s risk profile.
| Metric | 2025 | 2024 | 2023 |
|---|---|---|---|
| Debt to Equity | 1.46 | 0.81 | 0.98 |
| Debt to Assets | 16.99% | 6.82% | 6.76% |
| Debt to Capital | 59.43% | 44.90% | 49.53% |
| Net Debt to EBITDA | 0.92 | 0.14 | 0.26 |
| Current Ratio | 1.04 | 1.01 | 0.99 |
| Quick Ratio | 1.05 | 1.01 | 0.99 |
| Financial Leverage | 8.62 | 11.95 | 14.53 |
ADP's low debt levels relative to assets and equity indicate strong balance sheet management providing financial flexibility and stability. These elements are crucial for supporting sustained dividend payouts and operational growth.
📊 Fundamental Strength & Profitability
Evaluating fundamental strength and profitability provides insights into efficiency levels and overall operational effectiveness, influencing long-term growth and dividend sustainability.
| Metric | 2025 | 2024 | 2023 |
|---|---|---|---|
| Return on Equity (RoE) | 65.93% | 82.51% | 97.23% |
| Return on Assets (RoA) | 7.64% | 6.90% | 6.69% |
| Net Margin | 19.84% | 19.54% | 18.94% |
| EBIT Margin | 27.99% | 27.28% | 26.07% |
| EBITDA Margin | 30.36% | 30.20% | 29.12% |
| Gross Margin | 50.84% | 49.94% | 48.89% |
| R&D to Revenue | 4.83% | 4.98% | 4.69% |
ADP's high RoE and RoA reflect efficient management and robust profitability, essential for sustained growth and maintaining competitive dividends. Strong margins indicate sound cost control and value creation.
📈 Price Development
💡 Dividend Scoring System
| Category | Score | Visual |
|---|---|---|
| Dividend Yield | 4 | |
| Dividend Stability | 5 | |
| Dividend Growth | 3 | |
| Payout Ratio | 4 | |
| Financial Stability | 5 | |
| Dividend Continuity | 5 | |
| Cashflow Coverage | 4 | |
| Balance Sheet Quality | 4 |
Total Score: 34/40
🏆 Rating
Automatic Data Processing, Inc. demonstrates solid dividend fundamentals, consistent payout growth, and financial soundness, making it an attractive choice for income investors. Maintaining a high score across key categories, ADP offers reliability and a potential margin of safety amid market volatilities, cementing its position as a premium dividend stock. Investors are recommended to consider ADP for steady income and defensive growth.
Smart Data Insight
Master the Perfect Entry & Exit for this Stock
Don't leave your profits to chance. Historically, this stock follows specific seasonal patterns that institutional traders use to maximize returns.
- ✅ Identify the "Golden Buying Window"
- ✅ Avoid high-risk correction cycles
- ✅ Backtested data from the last 20+ years